Open Access
Fig. 6.
Download original image
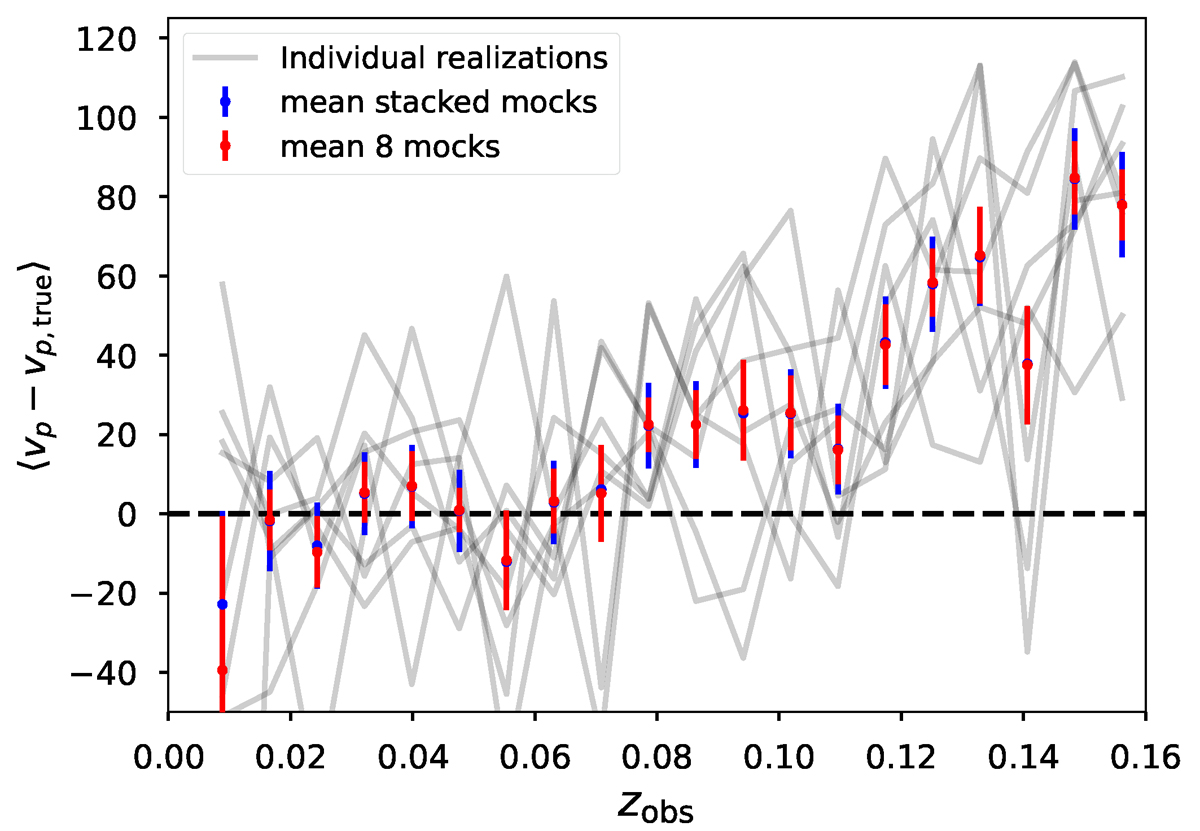
Difference between estimated PVs (vp) and true PVs (vp, true) as a function of the observed redshift for the Full sample. The solid gray lines shows the residual for each of the eight LSST realizations, the red points are the means over the eight mocks, and the blue points show the means computed by stacking all the mocks.
Current usage metrics show cumulative count of Article Views (full-text article views including HTML views, PDF and ePub downloads, according to the available data) and Abstracts Views on Vision4Press platform.
Data correspond to usage on the plateform after 2015. The current usage metrics is available 48-96 hours after online publication and is updated daily on week days.
Initial download of the metrics may take a while.