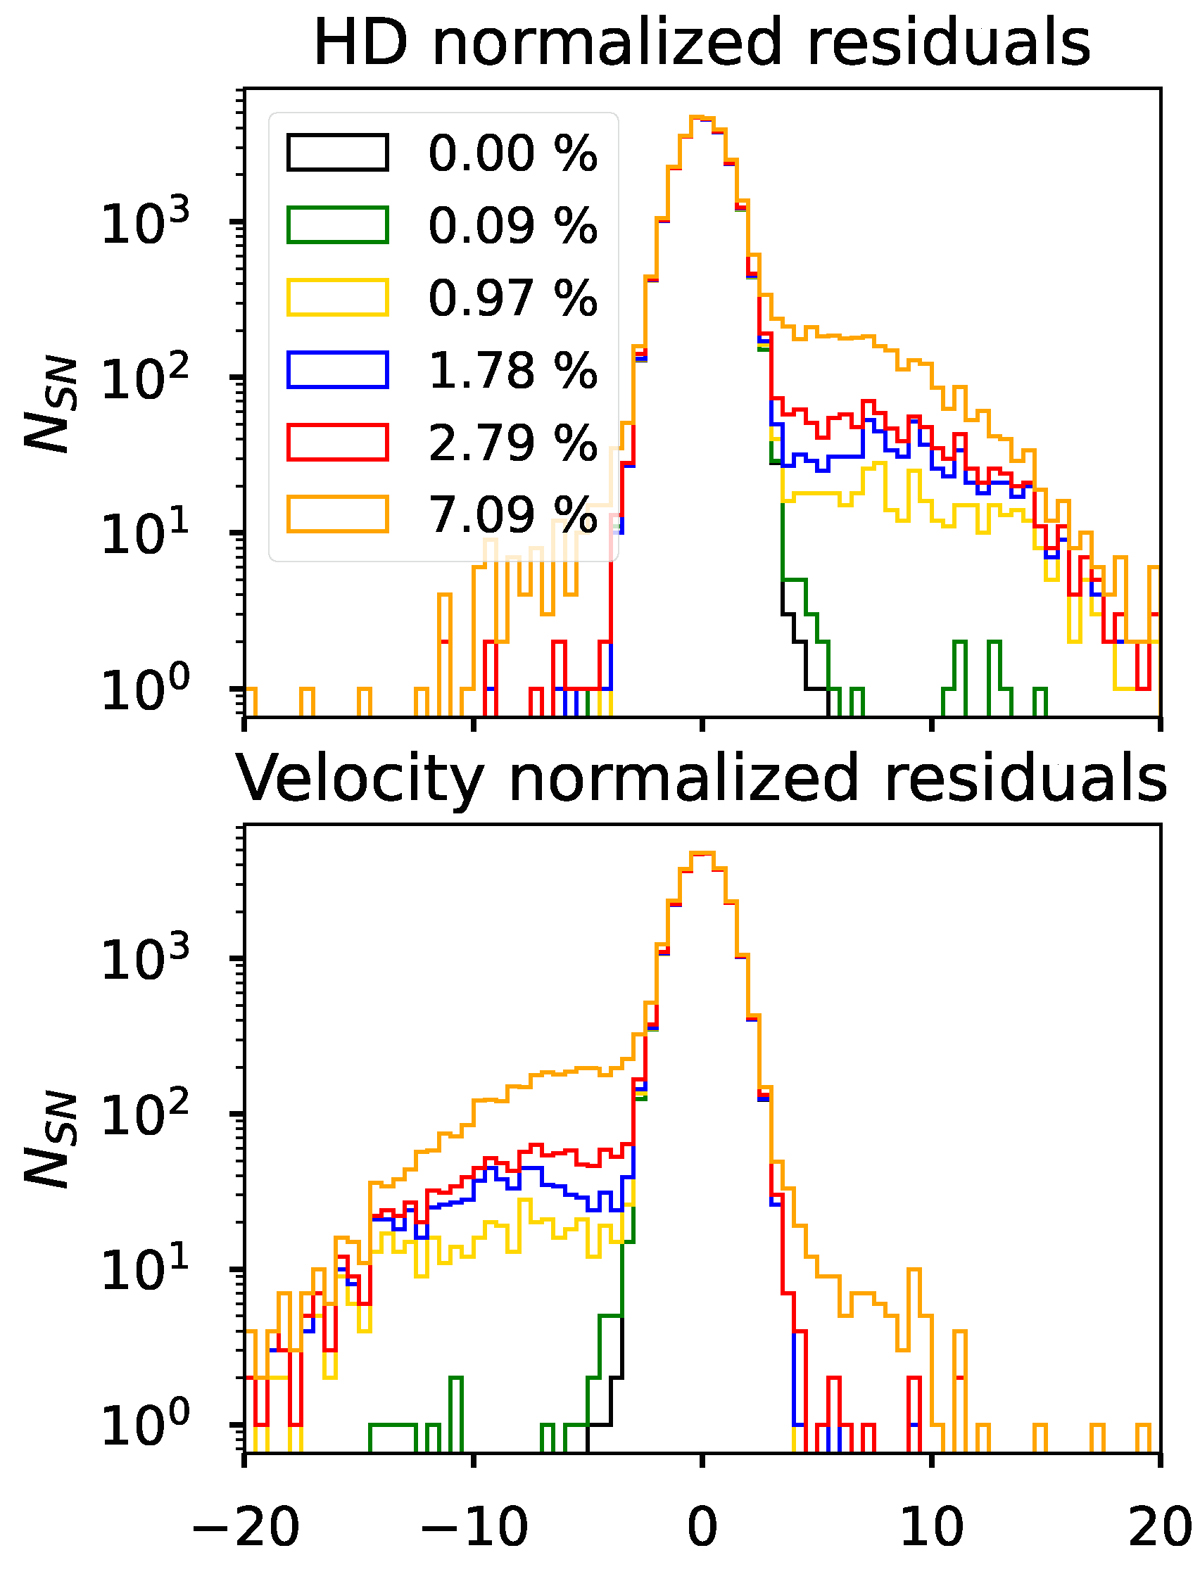
Fig. 8.
Download original image
HD residuals (top panel) and residuals of the estimated velocities (bottom panel), normalized by the errors, using the input HD parameters of the simulation. The plot shows the residuals for a random realization in the simulation in the redshift range 0.02 < z < 0.14. The different colors represent different SN samples with different levels of contamination, as shown in the legend.
Current usage metrics show cumulative count of Article Views (full-text article views including HTML views, PDF and ePub downloads, according to the available data) and Abstracts Views on Vision4Press platform.
Data correspond to usage on the plateform after 2015. The current usage metrics is available 48-96 hours after online publication and is updated daily on week days.
Initial download of the metrics may take a while.