Fig. 9.
Download original image
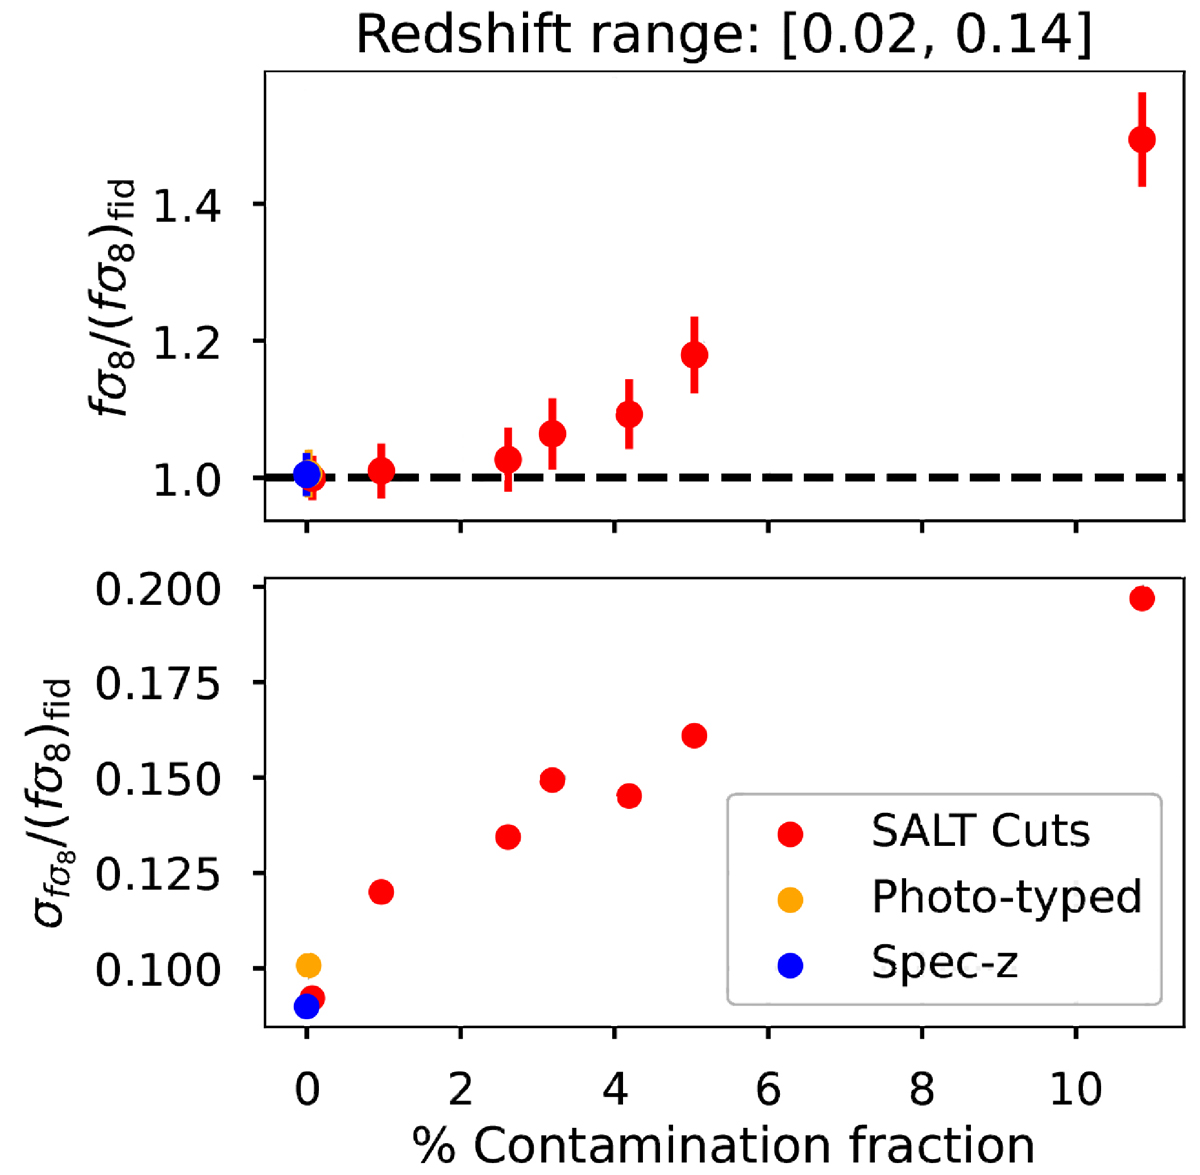
fσ8 fit results (top panel) and relative error (bottom panel) as a function of the sample contamination fraction for the redshift bin 0.02 < z < 0.14. The blue points show the results for the Spec-z sample, the orange points show the Photo-typed sample, and the red points show the different samples created using the cuts on the SALT fits as classification (SALT cuts). Every point is the average over the eight LSST realizations.
Current usage metrics show cumulative count of Article Views (full-text article views including HTML views, PDF and ePub downloads, according to the available data) and Abstracts Views on Vision4Press platform.
Data correspond to usage on the plateform after 2015. The current usage metrics is available 48-96 hours after online publication and is updated daily on week days.
Initial download of the metrics may take a while.