Fig. 11
Download original image
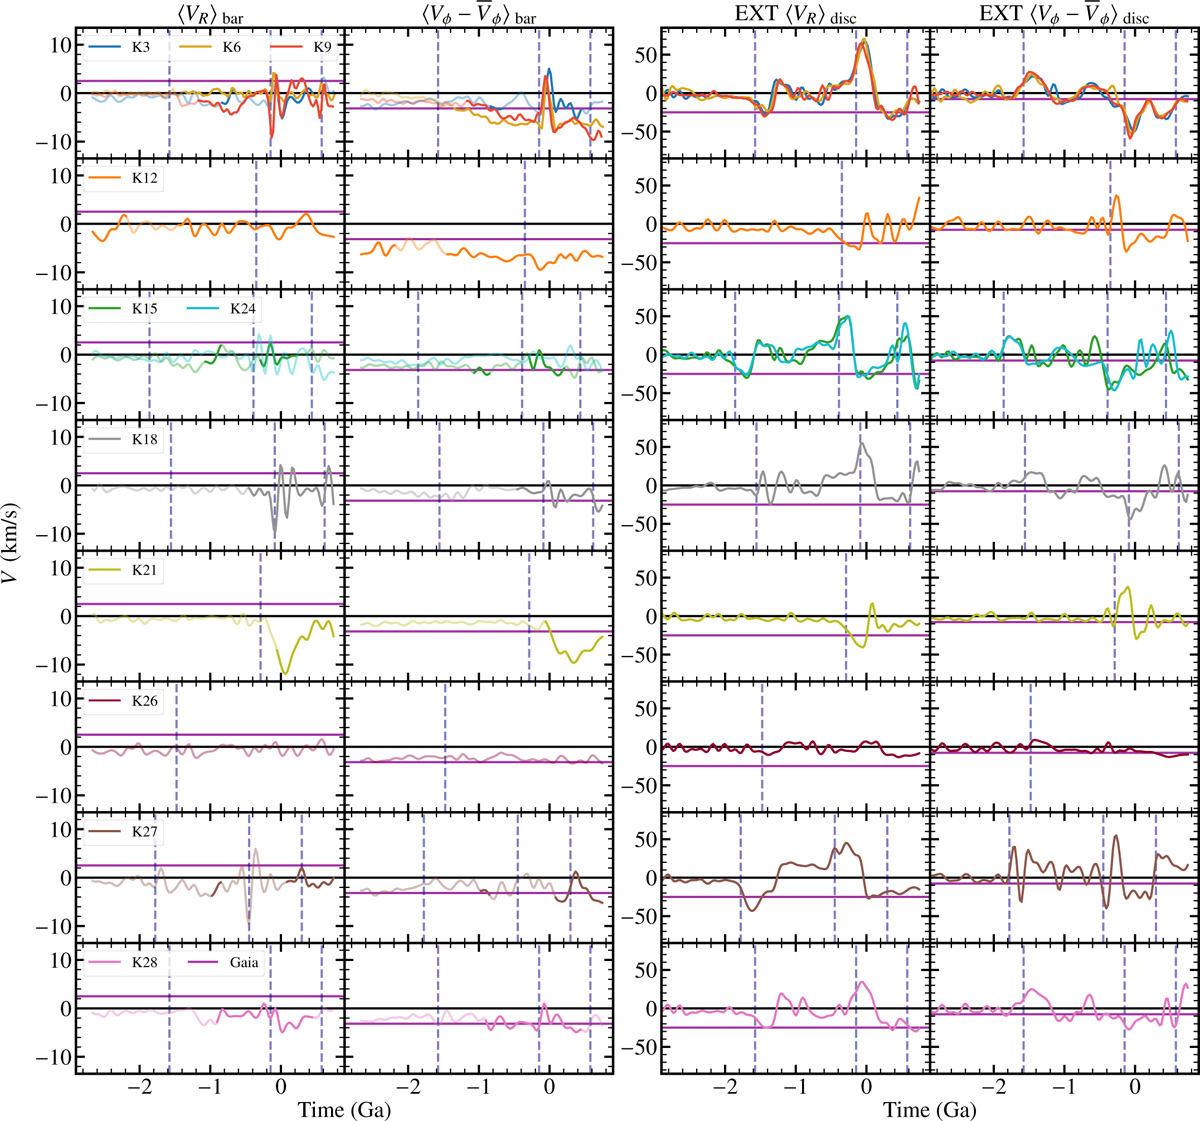
Bar asymmetry evolution (left two columns) and outer disc asymmetry evolution (right two columns), shown with cubic spline fits for all KRATOS simulations that include the full GMW–GLMC–GSMC interaction. Models are grouped together if they share pericentric passages between GLMC–GSMC (vertical dashed blue lines) at the same timestamps. The bar asymmetry evolution is measured in mean radial velocity, 〈VR〉 (left-most panels), and mean residual tangential velocity, ![]() (centre-left panels). Data is shown only after the first 1.25 Ga, when the disc is relaxed. It is presented with a solid line when a bar is formed (relative m = 2 Fourier amplitude Σ2/Σ0 > 0.2), and with a transparent line when there is no bar. The outer disc asymmetry evolution is represented by the extrema in the mean radial velocities, EXT〈VR〉 (centre-right panels), and extrema in the mean residual tangential velocities, EXT
(centre-left panels). Data is shown only after the first 1.25 Ga, when the disc is relaxed. It is presented with a solid line when a bar is formed (relative m = 2 Fourier amplitude Σ2/Σ0 > 0.2), and with a transparent line when there is no bar. The outer disc asymmetry evolution is represented by the extrema in the mean radial velocities, EXT〈VR〉 (centre-right panels), and extrema in the mean residual tangential velocities, EXT![]() (right-most panels). In all panels, the horizontal black lines mark zero asymmetry and the Gaia asymmetries are shown with horizontal purple lines.
(right-most panels). In all panels, the horizontal black lines mark zero asymmetry and the Gaia asymmetries are shown with horizontal purple lines.
Current usage metrics show cumulative count of Article Views (full-text article views including HTML views, PDF and ePub downloads, according to the available data) and Abstracts Views on Vision4Press platform.
Data correspond to usage on the plateform after 2015. The current usage metrics is available 48-96 hours after online publication and is updated daily on week days.
Initial download of the metrics may take a while.