Fig. 12
Download original image
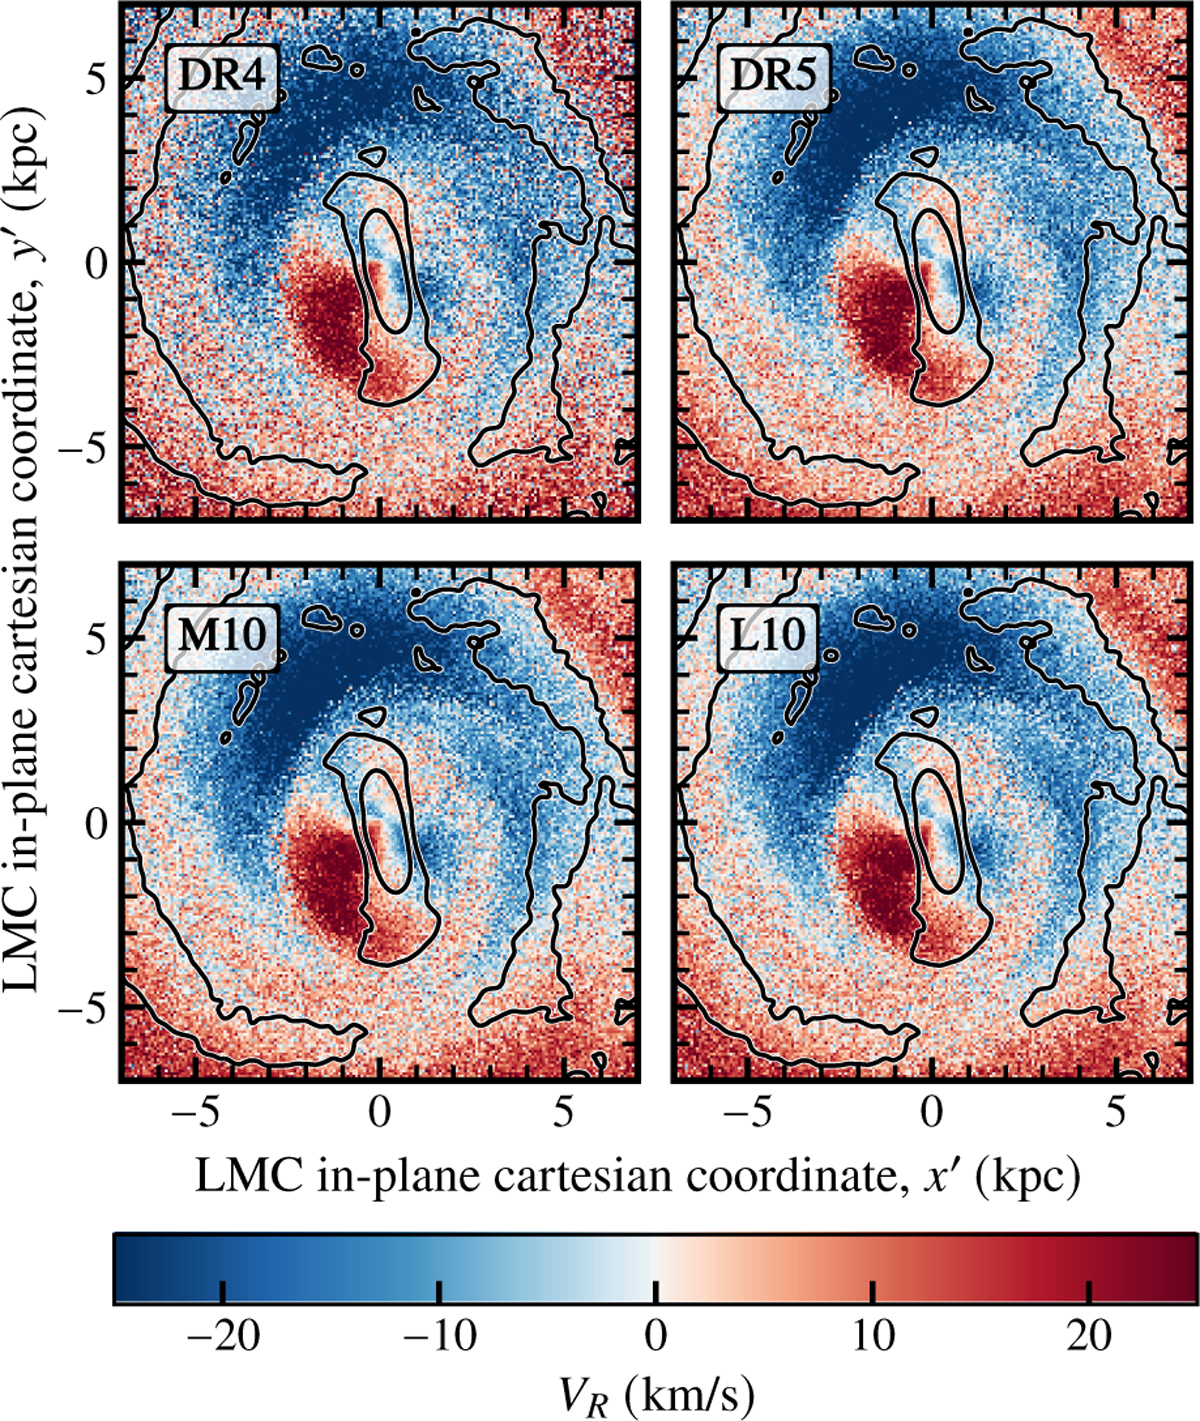
Comparison of the radial velocity maps of mock catalogues from the K6 simulation with observational errors of Gaia (DR4 and DR5, top row) and GaiaNIR (M10 and L10, bottom row). All maps are shown in the LMC in-plane (x′, y′) Cartesian coordinate system and zoomed-in to the centre co-ordinates to show the bar signature. Black contour lines separate the overdensities (bar and spiral arms) from the underdensities.
Current usage metrics show cumulative count of Article Views (full-text article views including HTML views, PDF and ePub downloads, according to the available data) and Abstracts Views on Vision4Press platform.
Data correspond to usage on the plateform after 2015. The current usage metrics is available 48-96 hours after online publication and is updated daily on week days.
Initial download of the metrics may take a while.