Fig. 2
Download original image
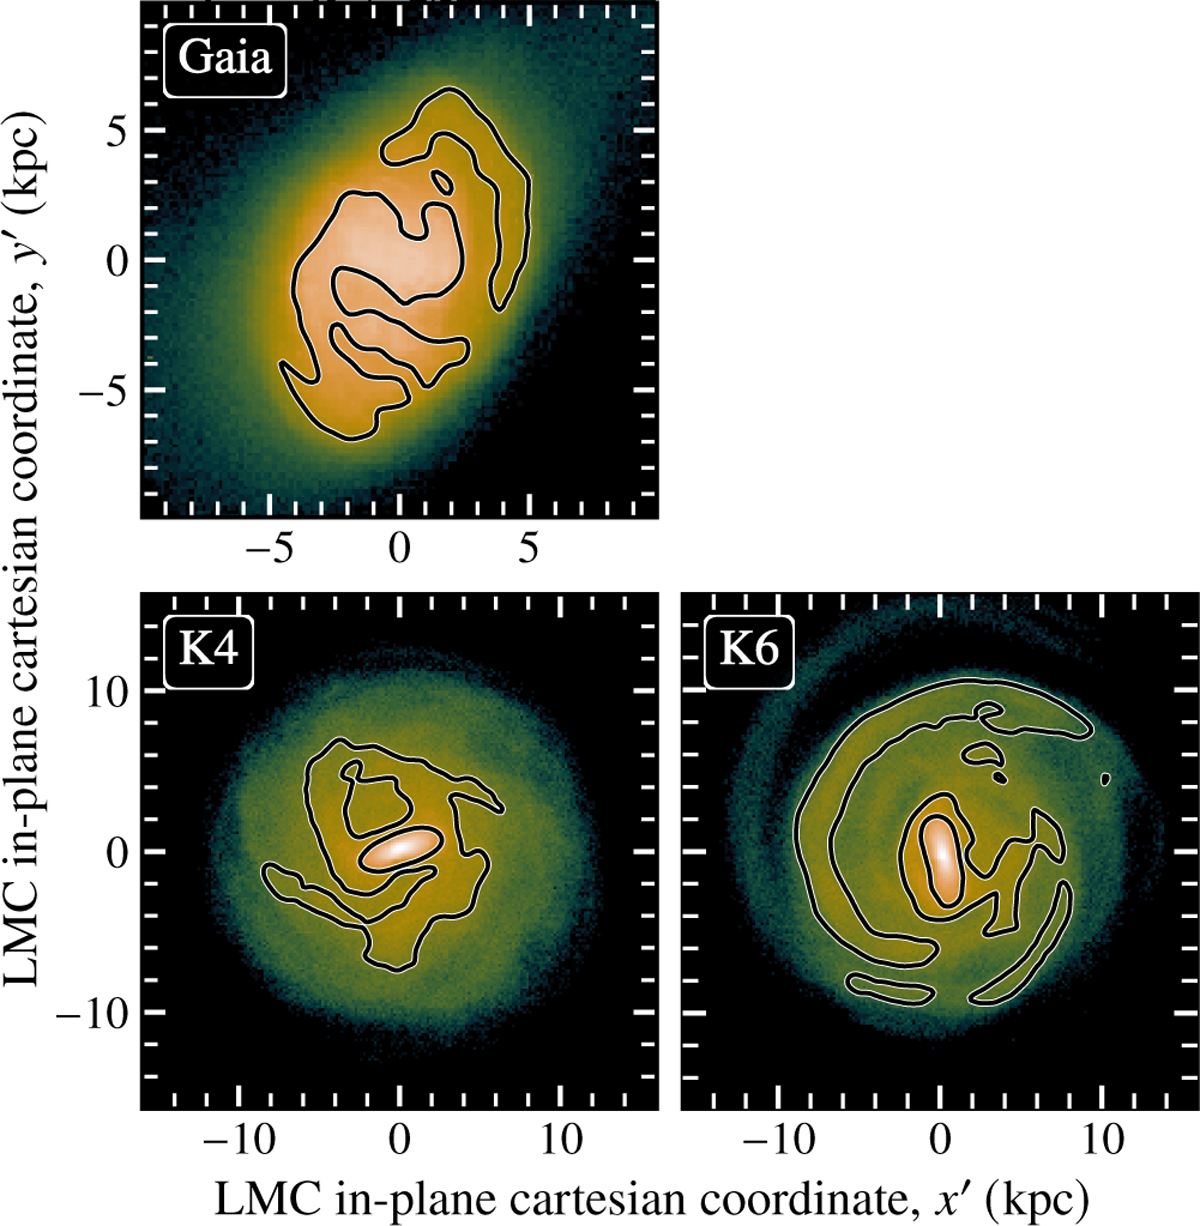
Density maps of the LMC optimal sample using Gaia DR3 data (top panel, JA23) and GLMC disc of the K4 and K6 simulations from the KRATOS suite (bottom panels, JA24). All maps are shown face-on, in the LMC in-plane (x′,y′) Cartesian coordinate system. Black contour lines separate the overdensities (bar and spiral arms) from the underdensities. The KRATOS simulations are shown at t = 0.105 Ga (see Sect. 4.3 for discussion).
Current usage metrics show cumulative count of Article Views (full-text article views including HTML views, PDF and ePub downloads, according to the available data) and Abstracts Views on Vision4Press platform.
Data correspond to usage on the plateform after 2015. The current usage metrics is available 48-96 hours after online publication and is updated daily on week days.
Initial download of the metrics may take a while.