Fig. 5
Download original image
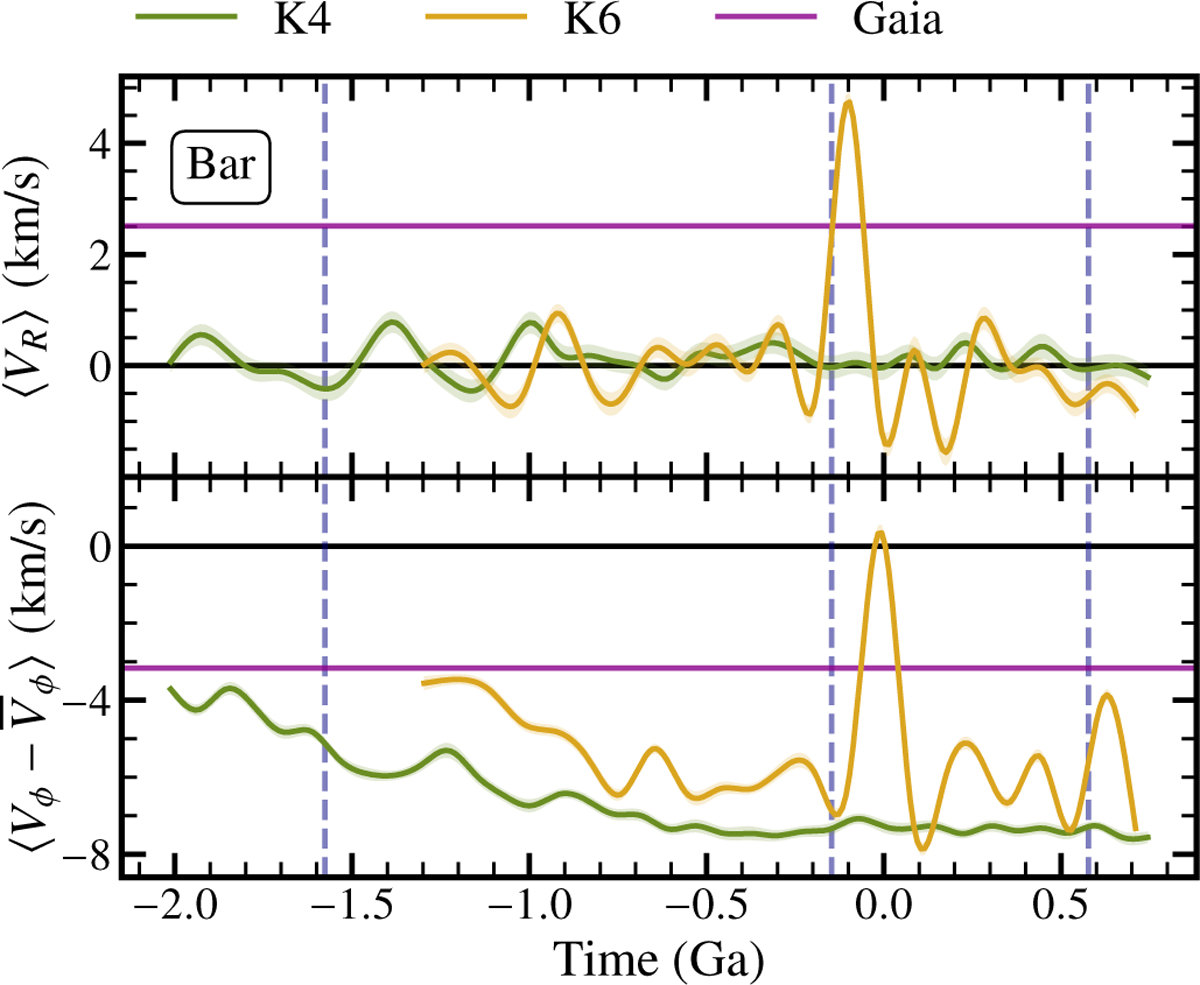
Mean radial velocity, 〈VR〉 (top panel), and mean residual tangential velocity, ![]() (bottom panel), asymmetry inside the GLMC bar for the K4 (green lines) and K6 (yellow lines) simulations, as a function of time. The Gaia asymmetry is shown with horizontal purple lines. The horizontal black lines mark zero net velocity. The vertical dashed blue lines represent the pericentric passages between GLMC–GSMC. We only show data points after the bar formation (relative m = 2 Fourier amplitude Σ2/Σ0 > 0.2).
(bottom panel), asymmetry inside the GLMC bar for the K4 (green lines) and K6 (yellow lines) simulations, as a function of time. The Gaia asymmetry is shown with horizontal purple lines. The horizontal black lines mark zero net velocity. The vertical dashed blue lines represent the pericentric passages between GLMC–GSMC. We only show data points after the bar formation (relative m = 2 Fourier amplitude Σ2/Σ0 > 0.2).
Current usage metrics show cumulative count of Article Views (full-text article views including HTML views, PDF and ePub downloads, according to the available data) and Abstracts Views on Vision4Press platform.
Data correspond to usage on the plateform after 2015. The current usage metrics is available 48-96 hours after online publication and is updated daily on week days.
Initial download of the metrics may take a while.