Fig. 7
Download original image
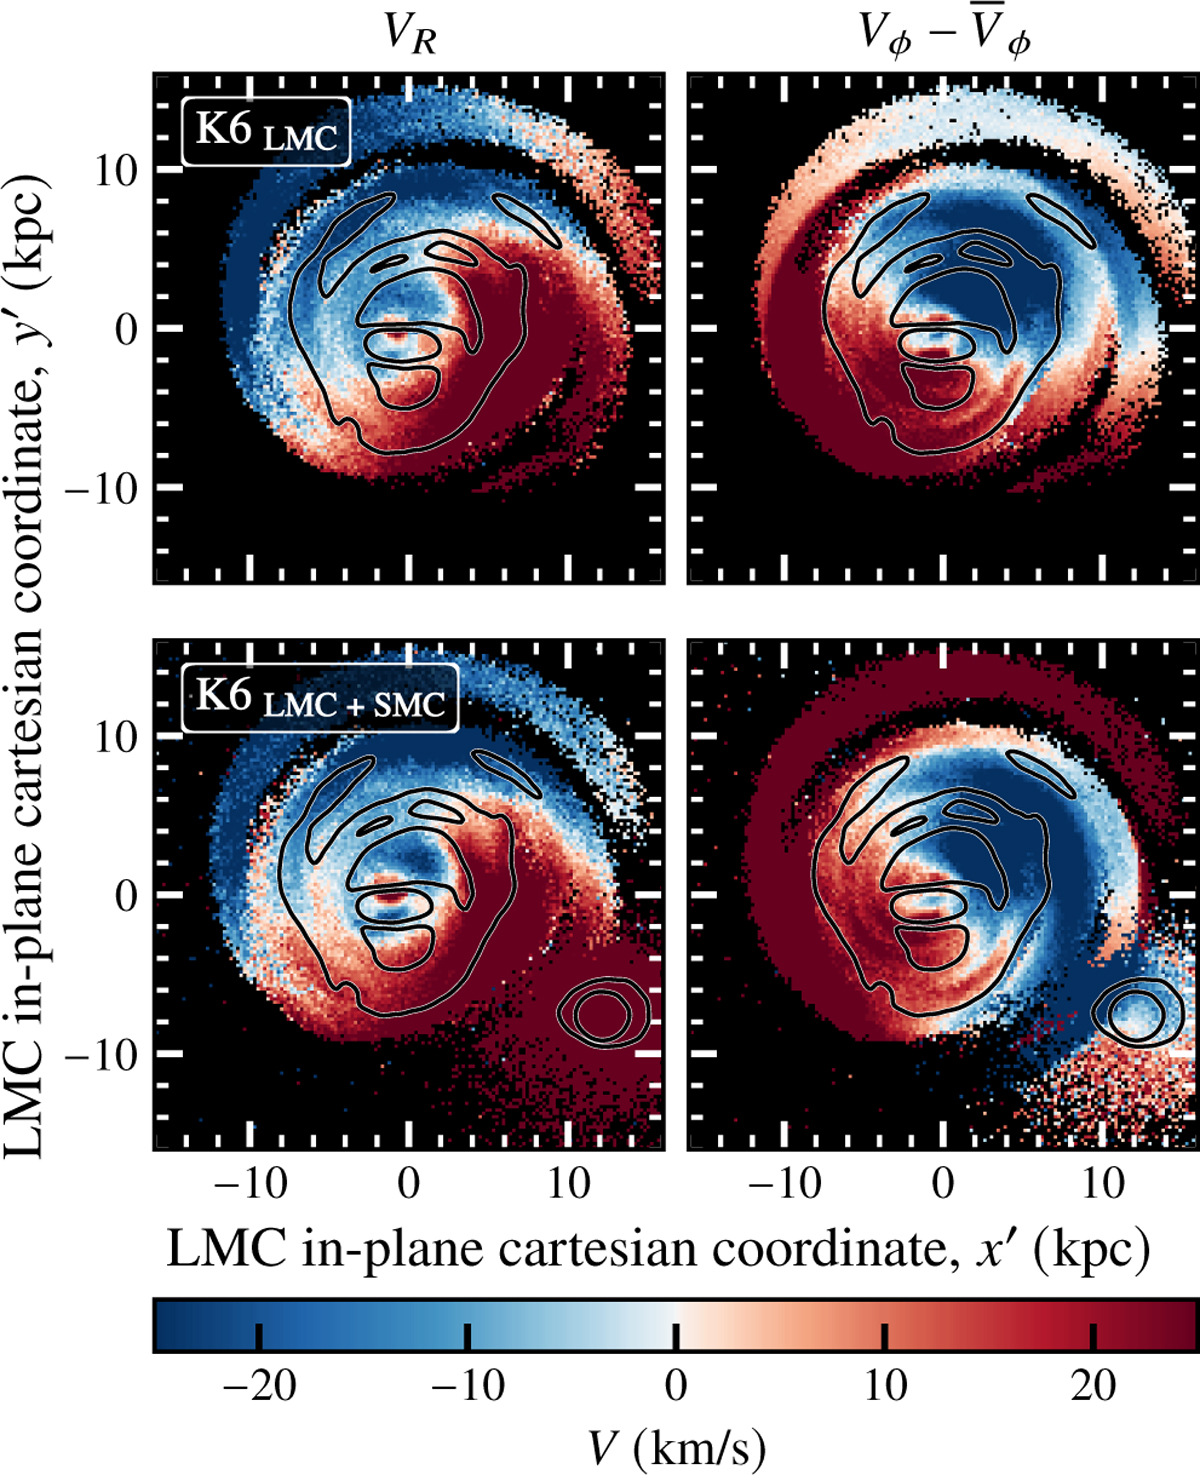
Comparison of the radial, VR (left panels), and residual tangential, ![]() (right panels), velocity maps between the GLMC and the GLMC – GSMC of the K6 simulation right after the second pericentric passage, at t = 0 Ga (KRATOS suite, JA24). We show the same snapshot of the K6 simulation for two cases: GLMC disc only (top panels), and GLMC disc and GSMC particles (bottom panels). All maps are seen face-on, in the LMC in-plane (x′,y′) Cartesian coordinate system. A black contour line separates the overdensities (bar and spiral arms) from the underdensities.
(right panels), velocity maps between the GLMC and the GLMC – GSMC of the K6 simulation right after the second pericentric passage, at t = 0 Ga (KRATOS suite, JA24). We show the same snapshot of the K6 simulation for two cases: GLMC disc only (top panels), and GLMC disc and GSMC particles (bottom panels). All maps are seen face-on, in the LMC in-plane (x′,y′) Cartesian coordinate system. A black contour line separates the overdensities (bar and spiral arms) from the underdensities.
Current usage metrics show cumulative count of Article Views (full-text article views including HTML views, PDF and ePub downloads, according to the available data) and Abstracts Views on Vision4Press platform.
Data correspond to usage on the plateform after 2015. The current usage metrics is available 48-96 hours after online publication and is updated daily on week days.
Initial download of the metrics may take a while.