Fig. 2.
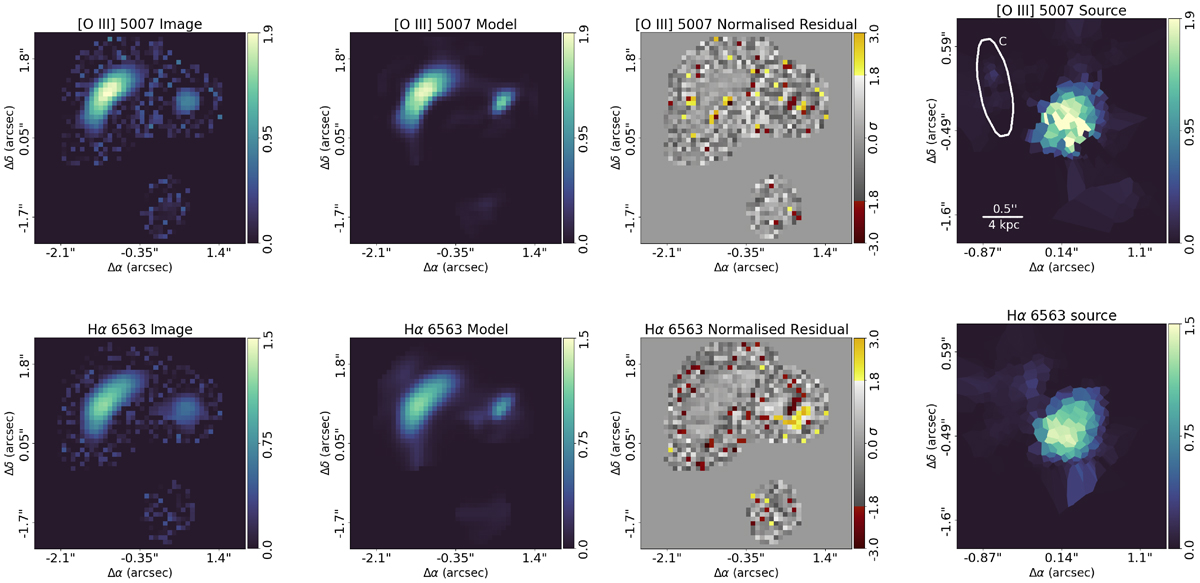
Download original image
Highest-likelihood EPL lens model. Each row illustrates a different emission line. From left to right, we present the modified (noise-added) observed image, the model image, the normalized residuals, and the reconstructed source. The top row details the [O III]λ5007 results, whereas the bottom row displays the Hα reconstruction, utilizing the mass model obtained from fitting the [O III]λ5007 emission. Fluxes are in units of 10−18 erg s cm−2.
Current usage metrics show cumulative count of Article Views (full-text article views including HTML views, PDF and ePub downloads, according to the available data) and Abstracts Views on Vision4Press platform.
Data correspond to usage on the plateform after 2015. The current usage metrics is available 48-96 hours after online publication and is updated daily on week days.
Initial download of the metrics may take a while.