Fig. A.1.
Download original image
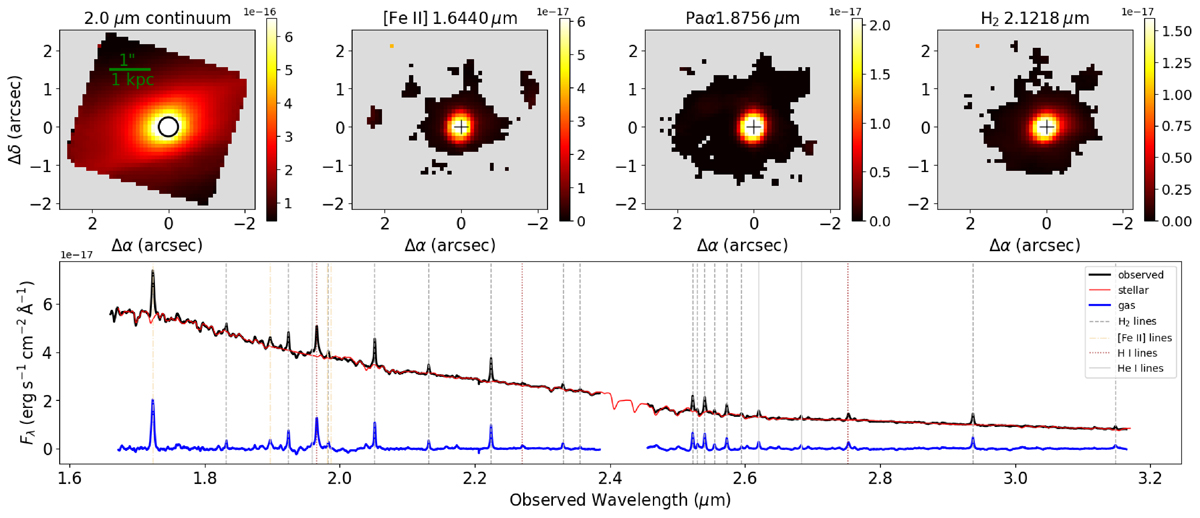
CGCG 012-070 galaxy. Top left panel: 2.0μm continuum image of CGCG 012-070, obtained from the NIRSpec data cube. Other top panels: Flux distributions of the [Fe II]1.6440μm, Paα, and H22.1218 μm emission lines. Gray regions represent masked out areas where the S/N < 3 and regions outside the NIRSpec FoV. The cross marks the position of the continuum peak. Bottom panel: Observed spectrum (in black), integrated over a 0![]() 25 radius nuclear aperture (black circle in the top left panel). The red curve represents the stellar population (SP) model, while the blue curve shows the gas contribution (observed - SP). Vertical lines mark the position of the main emission lines.
25 radius nuclear aperture (black circle in the top left panel). The red curve represents the stellar population (SP) model, while the blue curve shows the gas contribution (observed - SP). Vertical lines mark the position of the main emission lines.
Current usage metrics show cumulative count of Article Views (full-text article views including HTML views, PDF and ePub downloads, according to the available data) and Abstracts Views on Vision4Press platform.
Data correspond to usage on the plateform after 2015. The current usage metrics is available 48-96 hours after online publication and is updated daily on week days.
Initial download of the metrics may take a while.