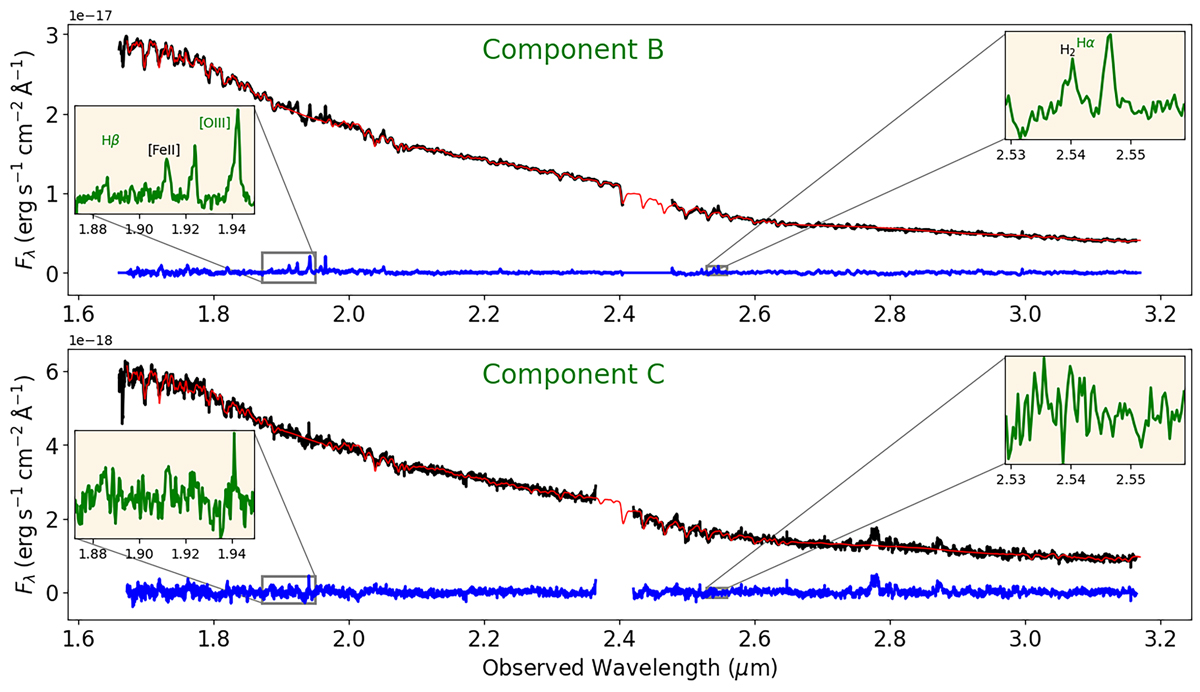
Fig. B.1.
Download original image
Integrated spectra for components B (top) and C (bottom). In each panel, the observed spectrum is shown in black, the stellar population contribution of CGCG 012-070 in red, and the gas component in blue. The insets provide a zoom-in on the [O III] and Hα regions for the lensed object. The [Fe II] and H2 labels identify emission lines from the foreground galaxy.
Current usage metrics show cumulative count of Article Views (full-text article views including HTML views, PDF and ePub downloads, according to the available data) and Abstracts Views on Vision4Press platform.
Data correspond to usage on the plateform after 2015. The current usage metrics is available 48-96 hours after online publication and is updated daily on week days.
Initial download of the metrics may take a while.