Fig. C.1.
Download original image
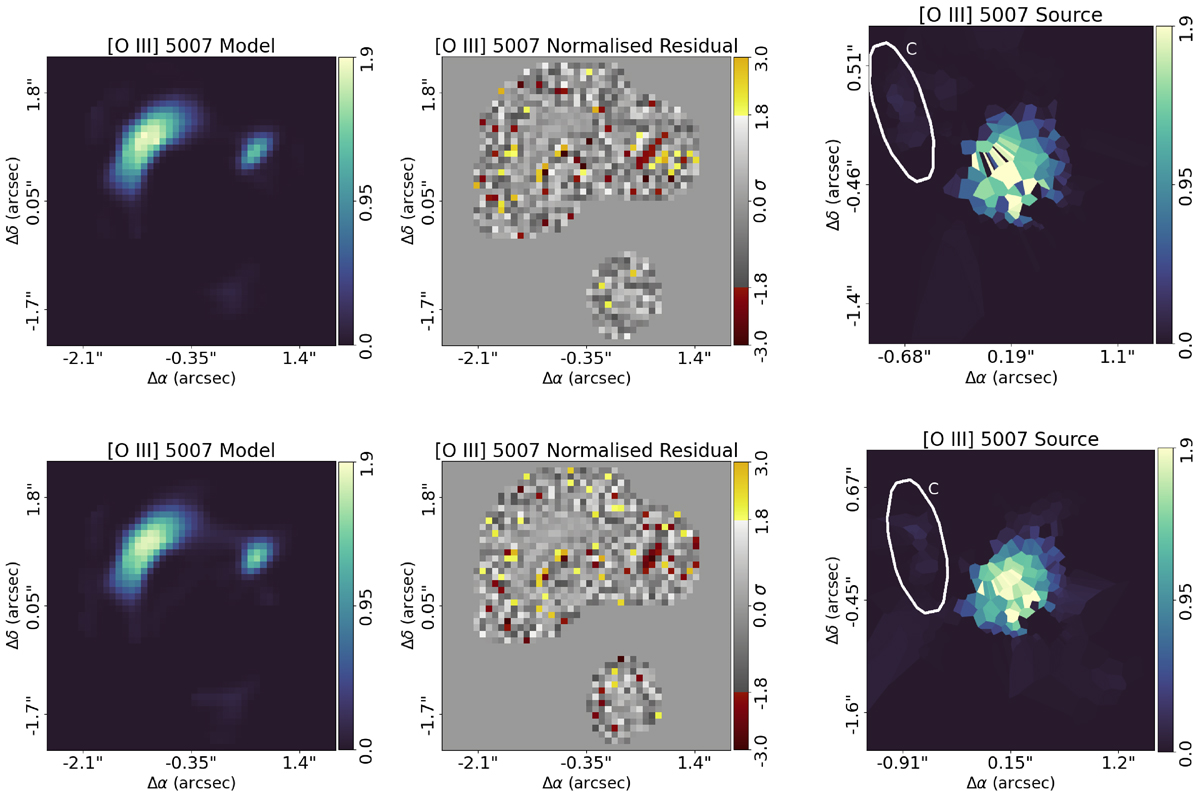
Highest-likelihood EPL lens models for alternative datasets. Each row illustrates a different assumption for the noise added to empty regions. From left to right: Model image, normalized residuals, and reconstructed source. Top row: Dataset where the modified image uses a σ10 dispersion. Bottom row: σ20 dispersion. Fluxes are in units of 10−18 erg s−1 cm−2.
Current usage metrics show cumulative count of Article Views (full-text article views including HTML views, PDF and ePub downloads, according to the available data) and Abstracts Views on Vision4Press platform.
Data correspond to usage on the plateform after 2015. The current usage metrics is available 48-96 hours after online publication and is updated daily on week days.
Initial download of the metrics may take a while.