Fig. 2.
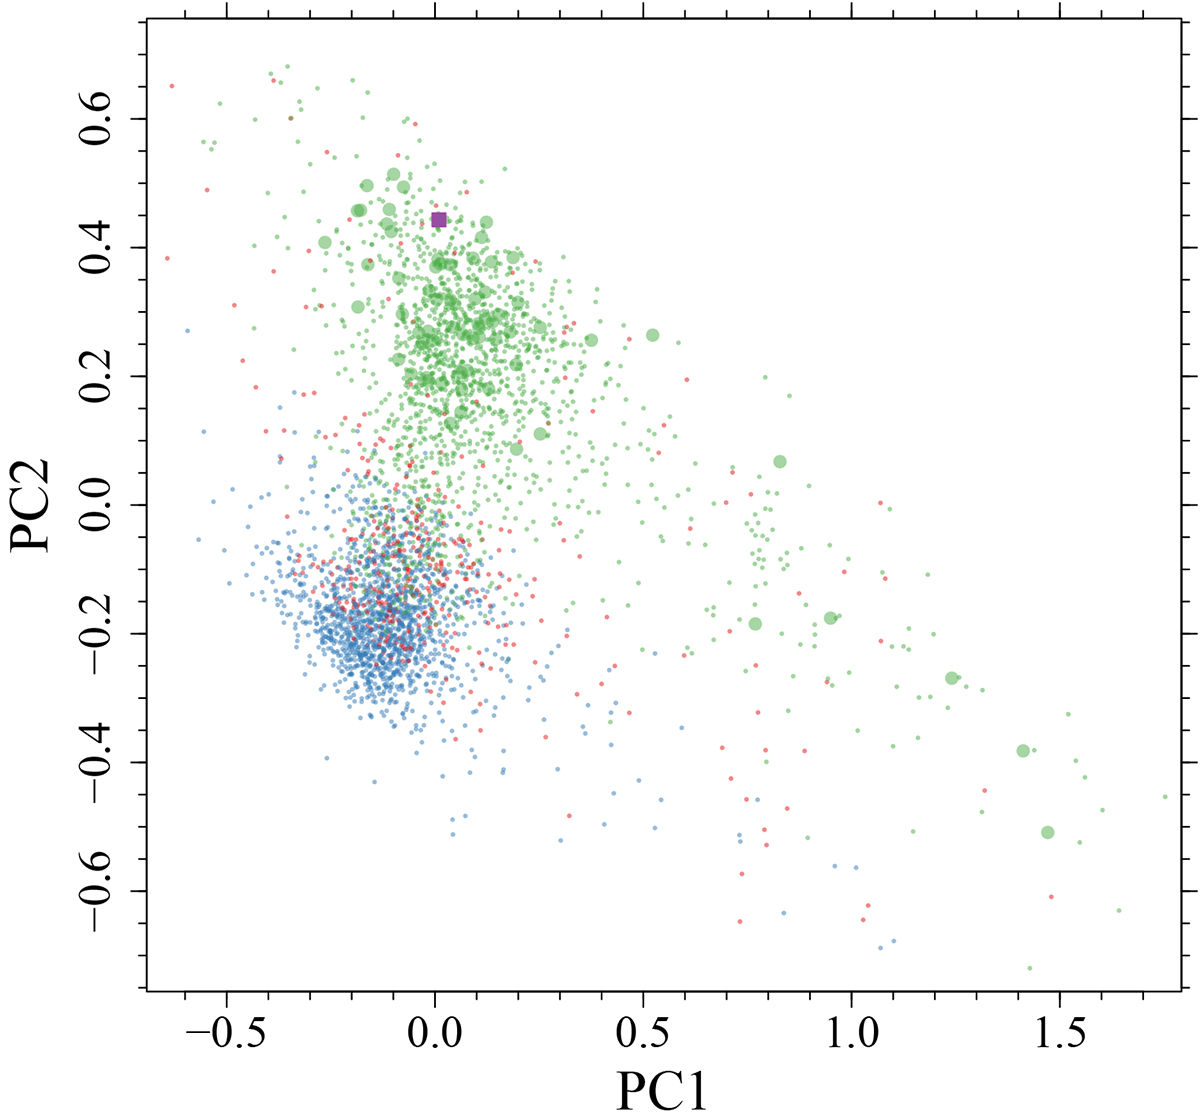
Download original image
Principal component analysis for the abundances of stars in the APO-K2 catalogue and BH2*. Blue and green points correspond, respectively, to the α-poor and α-rich populations – generally identified by thin and thick disc components. Red points identify transition stars not unambiguously classified in the two previous groups (see Schonhut-Stasik et al. 2024, for details about the classification). Larger symbols identify young α-rich stars (see text). The position of BH2* is marked by a purple square.
Current usage metrics show cumulative count of Article Views (full-text article views including HTML views, PDF and ePub downloads, according to the available data) and Abstracts Views on Vision4Press platform.
Data correspond to usage on the plateform after 2015. The current usage metrics is available 48-96 hours after online publication and is updated daily on week days.
Initial download of the metrics may take a while.