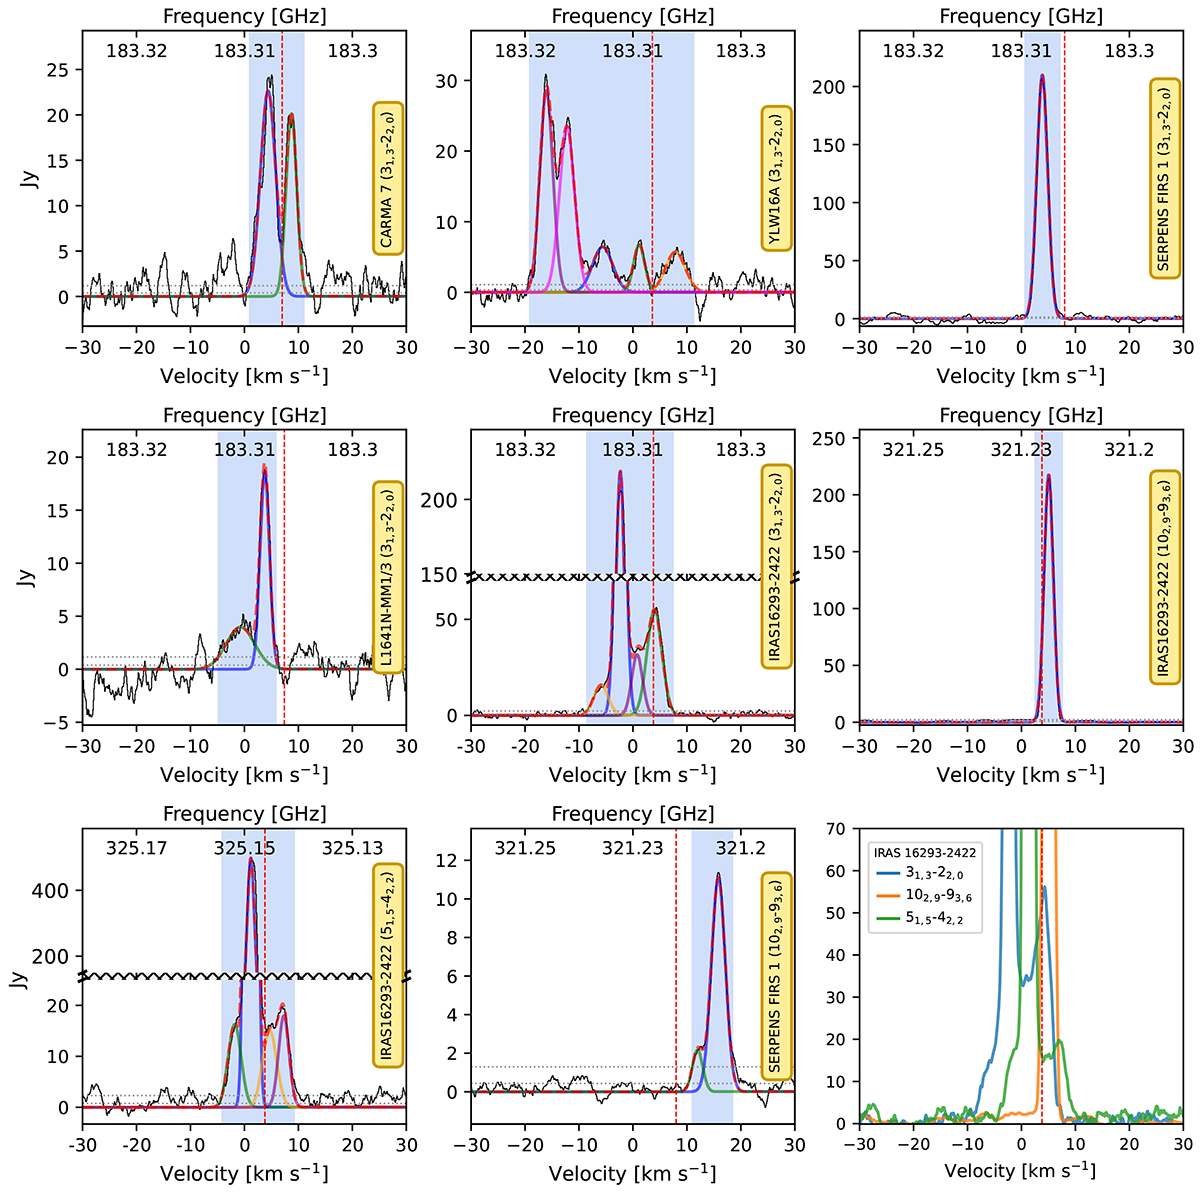
Fig. 1.
Download original image
Water maser transitions detected in our sample (Table A.1). Source names and maser transitions are indicated to the right of each panel. Velocities are given in the observed frame. The observed spectra are displayed in black, and single or multiple Gaussian fits are overplotted as colored, semitransparent solid lines. The total fitted emission is shown as a dashed red line. Vertical dashed red lines indicate the systemic velocities of the sources, as listed in Table A.1. For a few panels, the ordinate axis is limited between 20 and 150 Jy to better highlight weaker features. Shaded blue regions indicate the full velocity range of the maser emission, defined as the interval where the fitted model exceeds 3σ above the baseline noise. Horizontal dashed black lines mark the 1 and 3σ noise levels, estimated over the shown velocity range excluding the shaded regions. The bottom-right panel combines all IRAS 16293–2422 submillimeter transitions with a flux limit of 70 Jy to highlight weak spectral features.
Current usage metrics show cumulative count of Article Views (full-text article views including HTML views, PDF and ePub downloads, according to the available data) and Abstracts Views on Vision4Press platform.
Data correspond to usage on the plateform after 2015. The current usage metrics is available 48-96 hours after online publication and is updated daily on week days.
Initial download of the metrics may take a while.