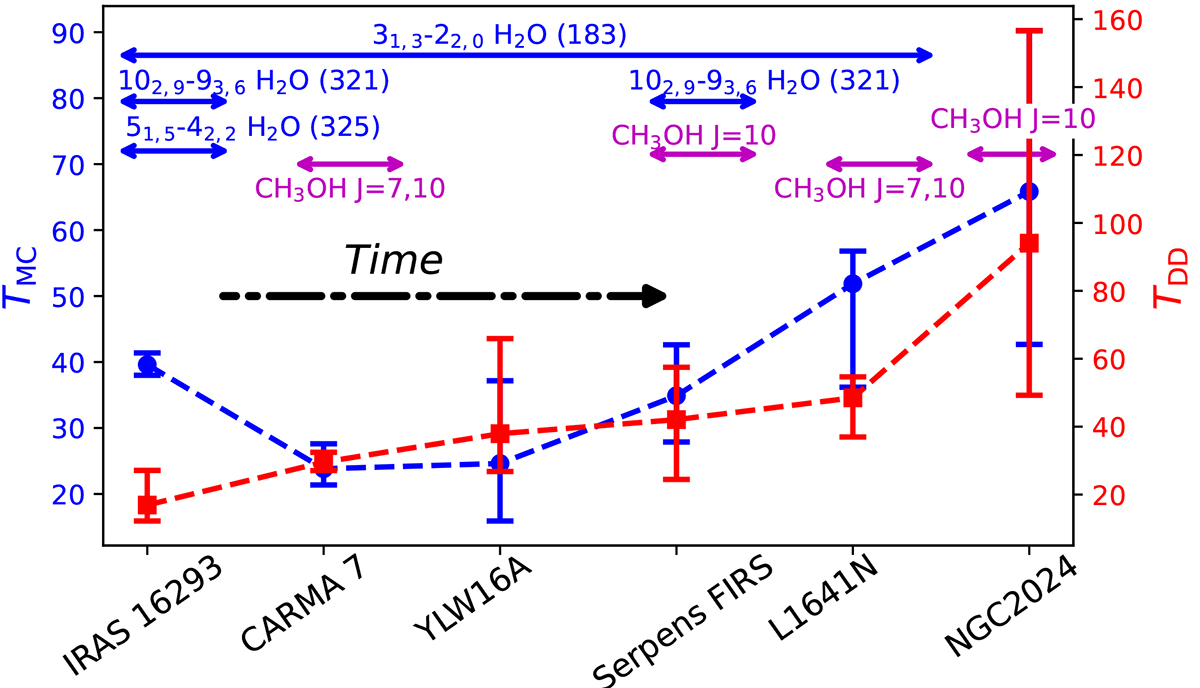
Fig. 2.
Download original image
Sources are ordered along the x-axis from youngest to oldest, based on the diffuse dust temperature TDD (see Table 1), which is shown in red and corresponds to the rightmost y-axis. The left y-axis shows the molecular cloud temperature (TMC, in blue), derived from gray-body fits to the SED using the same methodology as for TDD (see Appendix B). Water and MM detections are indicated above each source, with water maser transitions labeled by their frequency in GHz. All temperatures are in kelvin.
Current usage metrics show cumulative count of Article Views (full-text article views including HTML views, PDF and ePub downloads, according to the available data) and Abstracts Views on Vision4Press platform.
Data correspond to usage on the plateform after 2015. The current usage metrics is available 48-96 hours after online publication and is updated daily on week days.
Initial download of the metrics may take a while.