Fig. 1.
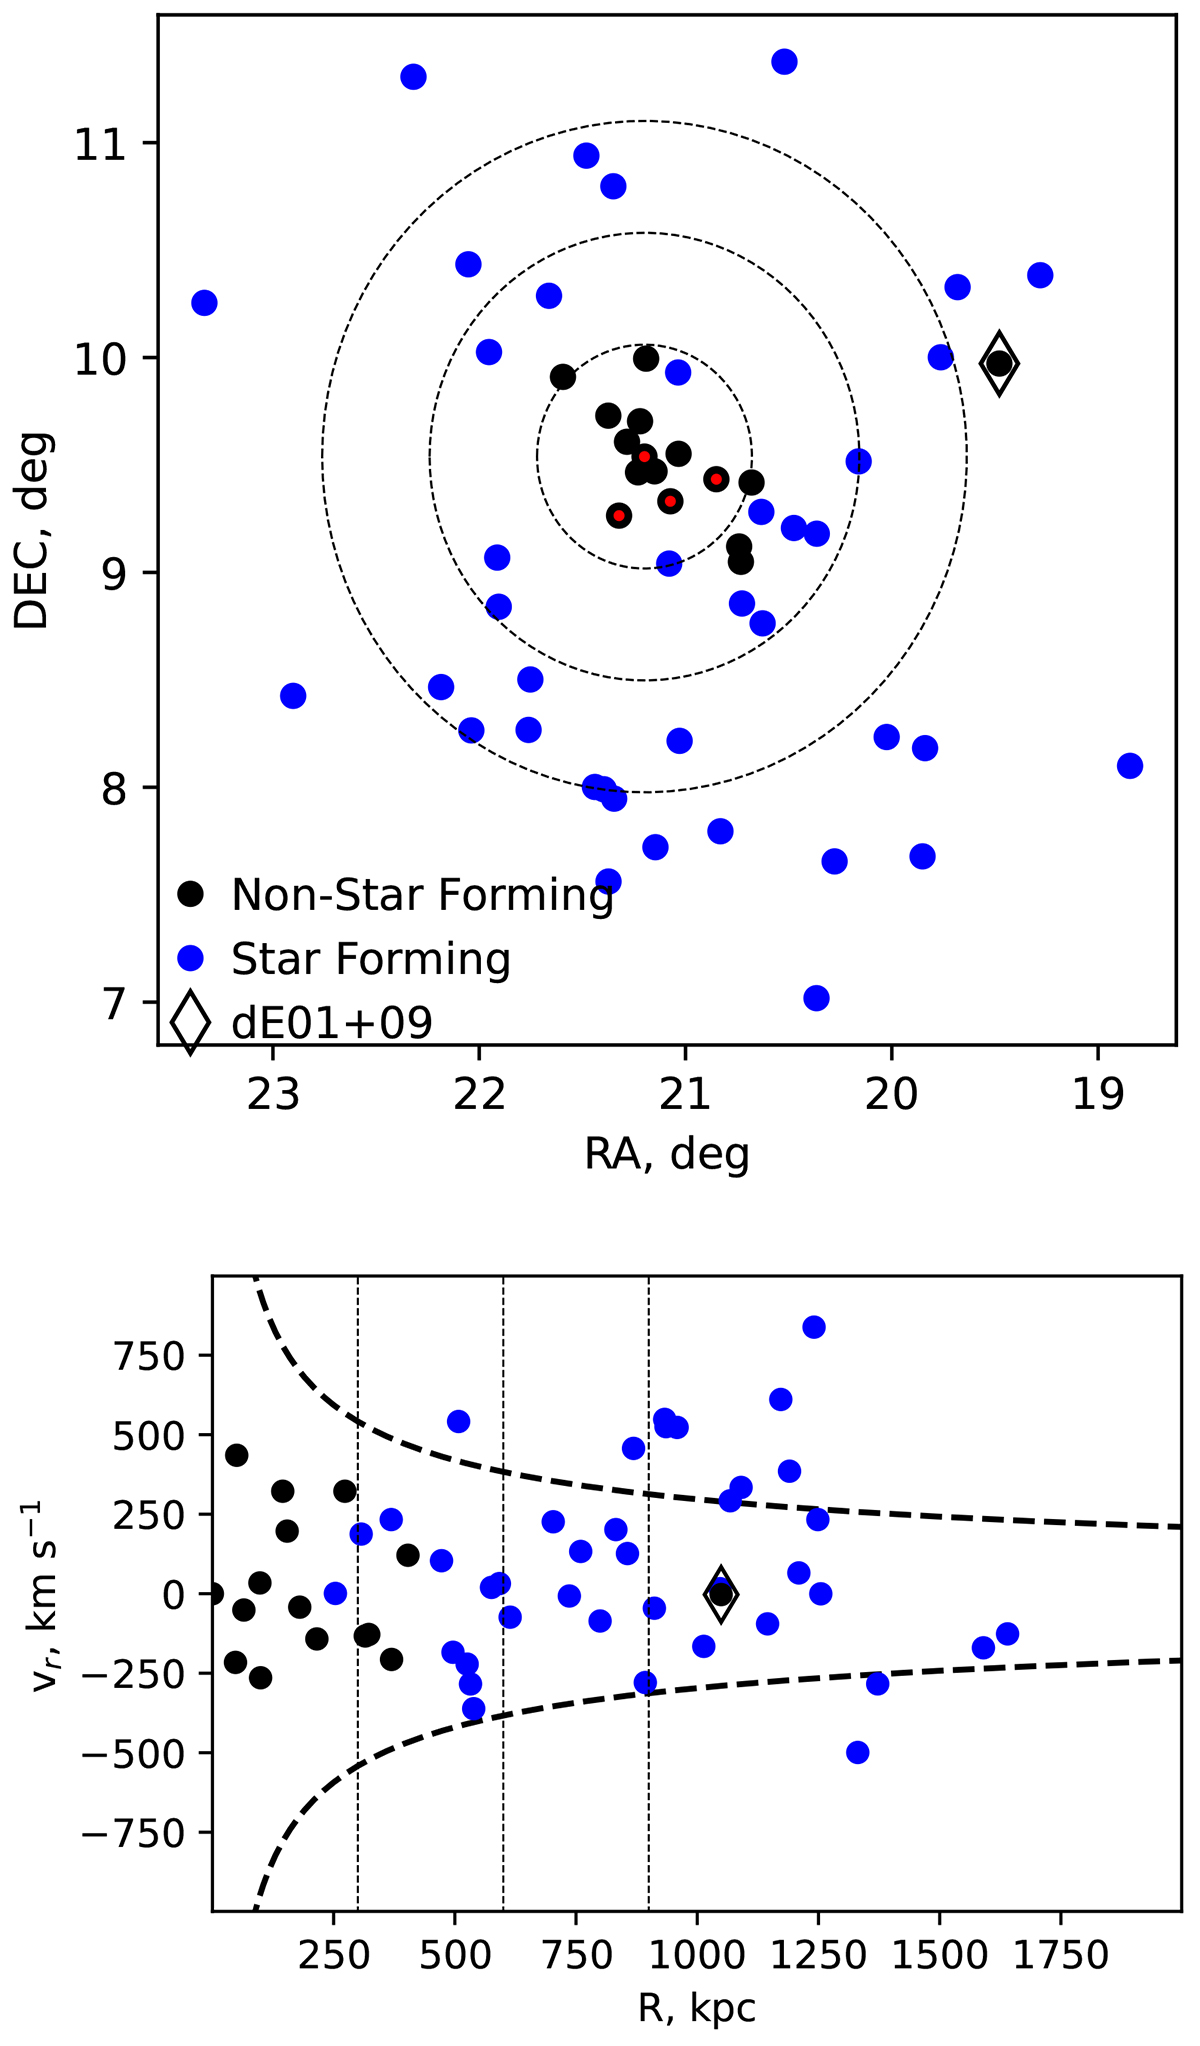
Download original image
Top: Spatial distribution of galaxies around NGC 524 from NED, within a velocity range of ±1000 km s−1 relative to the line-of-sight velocity of NGC 524. Star-forming and non-star-forming galaxies are shown in black and blue, respectively. The red dots represent massive (M* > 1010 M⊙) galaxies. The three concentric short-dashed circles indicate projected distances of one, two, and three times the group’s virial radius. The position of dE01+09 is highlighted with an open diamond symbol. Bottom: Phase-space diagram of galaxies around NGC 524. The thick dashed loci indicate the escape velocity profile of the group, assuming a total mass of 1013 M⊙. The vertical short-dashed lines denote one, two, and three times the group’s virial radius.
Current usage metrics show cumulative count of Article Views (full-text article views including HTML views, PDF and ePub downloads, according to the available data) and Abstracts Views on Vision4Press platform.
Data correspond to usage on the plateform after 2015. The current usage metrics is available 48-96 hours after online publication and is updated daily on week days.
Initial download of the metrics may take a while.