| Issue |
A&A
Volume 701, September 2025
|
|
|---|---|---|
| Article Number | L9 | |
| Number of page(s) | 5 | |
| Section | Letters to the Editor | |
| DOI | https://doi.org/10.1051/0004-6361/202556457 | |
| Published online | 11 September 2025 | |
Letter to the Editor
An isolated early-type dwarf galaxy that ran away from the group environment
1
Department of Astronomy, Yonsei University, Seoul 03722, Republic of Korea
2
Center for Galaxy Evolution Research, Yonsei University, Seoul 03722, Republic of Korea
3
Natural Science Research Institute (NSRI), University of Seoul, Seoul 02504, Republic of Korea
4
Department of Physics, Astronomy, Geology and Environmental Sciences, Youngstown State University, Youngstown, OH, USA
5
Department of Physics and Astronomy, The University of Tennessee, Knoxville, TN 37996, USA
⋆ Corresponding author: This email address is being protected from spambots. You need JavaScript enabled to view it.
Received:
17
July
2025
Accepted:
26
August
2025
Abstract
Understanding the quenching mechanisms in dwarf galaxies is crucial for constraining models of galaxy formation and evolution. Isolated dwarf galaxies offer valuable insight by helping disentangle the relative roles of internal and environmental processes in shutting down star formation. Here we report the discovery of a quiescent early-type dwarf galaxy (dE), SDSS J011754.86+095819.0 (hereafter dE01+09), located in a nearly isolated environment at a projected distance of approximately one megaparsec from its most likely host group, the NGC 524 group. dE01+09 has Mr = −15.72 and g − r = 0.67 mag and its light profile is well described by a Sérsic function with an index n = 1.1, consistent with typical dEs. Using optical spectroscopy from the DESI survey, we derived its simple stellar population properties, and found an intermediate luminosity-weighted age of 8.3 ± 1.4 Gyr and a subsolar metallicity of −1.19 ± 0.21 dex, characteristics comparable to those of classical quiescent dEs. We propose that NGC 524 may represent an extreme example of group dynamics, in which a member galaxy, dE01+09, was ejected from its host group and subsequently evolved as an isolated system in the field.
Key words: galaxies: dwarf / galaxies: groups: general / galaxies: interactions
© The Authors 2025
 Open Access article, published by EDP Sciences, under the terms of the Creative Commons Attribution License (https://creativecommons.org/licenses/by/4.0), which permits unrestricted use, distribution, and reproduction in any medium, provided the original work is properly cited.
This article is published in open access under the Subscribe to Open model. This email address is being protected from spambots. You need JavaScript enabled to view it. to support open access publication.
1. Introduction
Understanding how galaxies quench is essential for explaining the various internal and environmental processes that shape galaxy evolution. Quenching typically involves the depletion, removal, or disruption of a galaxy’s reservoir of star-forming gas. Internal factors such as active galactic nuclei, supernovae, and stellar feedback play a key role in halting star formation by heating or expelling cold gas (Croton et al. 2006; Hopkins et al. 2012). On the other hand, environmental processes such as ram-pressure stripping (RPS), tidal harassment, and starvation can also remove or deplete the gas reservoir (Gunn & Gott 1972; Larson et al. 1980; Moore et al. 1996; Simpson et al. 2018; Cortese et al. 2021).
The strong correlation between morphology and density observed in low-mass galaxies is widely believed to be shaped by environmental effects during their evolution. In particular, early-type dwarf galaxies (dEs), a class of low-mass non-star-forming galaxies, are most commonly found in galaxy clusters or groups, suggesting that their origins are closely tied to environmental influences (Binggeli et al. 1988; Boselli & Gavazzi 2006; Lisker et al. 2007). Even so, the relative contributions of different environmental mechanisms (e.g., RPS, harassment, or starvation) in shaping the stellar populations and structural features of dEs remain unclear (Boselli & Gavazzi 2006; Mayer et al. 2001; Smith et al. 2010). Among these, RPS is considered especially effective in dense cluster environments, with numerous recent studies reporting active cases of RPS, particularly within the Virgo Cluster (Kenney et al. 2004, 2014; Vollmer et al. 2001).
However, the recent discoveries of isolated dEs1, which do not belong to any galaxy cluster or group, have reignited the debate about dE formation: whether all dEs necessarily form through the influence of their local environment (Janz et al. 2017; Bidaran et al. 2025). Although dwarf–dwarf galaxy mergers do occur in low-density environments (Paudel et al. 2018), they tend to involve at least one star-forming dwarf galaxy.
From a theoretical perspective, the existence of backsplash galaxies, which are systems that once resided within the virial radius of a galaxy cluster or group but have since traveled beyond it, has important implications for our understanding of galaxy evolution in different environments (Gill et al. 2005; Pimbblet 2011; Borrow et al. 2023). These galaxies provide evidence that environmental effects such as RPS, tidal interactions, and galaxy harassment are not strictly confined within cluster boundaries. Instead, galaxies can undergo significant environmental processing deep within a dense halo and later appear in regions traditionally considered the domain of isolated systems (Wetzel et al. 2014). This challenges the classical dichotomy between field and cluster galaxies and suggests that a galaxy’s present-day location does not necessarily reflect its full interaction history.
In particular, Chilingarian & Zolotukhin (2015) argued that some observed isolated compact elliptical (cE) galaxies and quiescent dwarf galaxies, which are systems found far from any massive host, may not have formed in situ. Rather, they could be the remnants of galaxies that were tidally stripped during close passages through a group or cluster and subsequently ejected to the outskirts or beyond the virial radius. These runaway galaxies therefore occupy regions that appear isolated today, but carry the signatures of a turbulent past in denser environments.
In this study we report the discovery of a dE, SDSS J011754.86+095819.0 (hereafter dE01+09), which appears to be located at a large distance from its host group. It currently resides in a nearly isolated region, at a projected distance of approximately one megaparsec from its likely host group, NGC 5242.
2. Finding isolated early-type dwarf galaxies
We conducted a systematic search for low-mass early-type galaxies across various environments–clusters, groups, and fields–within the local volume (z < 0.01). To achieve this, we visually inspected a large area of the sky using data from the SDSS and Legacy imaging surveys, identifying 5054 dEs located in clusters and groups. The resulting main catalog was published in Paudel et al. (2023). The strength of this catalog lies in its detailed description of the spatial distribution of dEs in relation to their local environments. Our findings indicate that a significant majority of present-day dEs are found in clusters and become increasingly rare in low-density regions. Additionally, we observed a correlation between dEs and their nearest bright neighbor galaxies, suggesting that dEs are more likely to form in regions where their nearest bright neighbors are non-star-forming.
To advance our efforts in identifying dEs in low-density environments, we analyzed the morphological properties of dwarf galaxies observed in the DESI survey (DR1) (DESI Collaboration 2025). By combining the redshift catalogs from SDSS and DESI, we characterized the local environments of dwarf galaxies within z < 0.01. For morphological classification, we employed a state-of-the-art machine learning tool trained on a reference sample of 5000 previously cataloged dEs (see Appendix for details). This analysis lead to the identification of 751 dEs with confirmed redshifts, including 183 not found in earlier catalogs. The full methodology and results will be presented in an upcoming publication. Notably, one of these galaxies (dE01+09) lies in near-complete isolation, making it particularly intriguing (see Table 1).
Properties of dE01+09.
dE01+09 is located at a redshift of z = 0.008 to the east of the NGC 524 group, at an angular distance of 1.2 degrees, corresponding to approximately 1.2 Mpc in sky-projected physical scale, from the group center. The top panel of Figure 1 shows the distribution of galaxies around the group within a line-of-sight radial velocity range of ±1000 km s−1 relative to NGC 524. Within NGC 524, most member galaxies are indeed non-star-forming within the virial radius of 300 kpc3. Unexpectedly, we find the non-star-forming dwarf, dE01+09, located beyond three times the virial radius from the center of the group. Interestingly, we do not find any massive galaxies with M* > 1010 M⊙ within a sky-projected radius of 700 kpc and a radial velocity range of ±500 km s−1 from dE01+09. In this sense, dE01+09 can be considered a truly isolated dE, as many previous studies have used this criterion to identify isolated dwarf galaxies (Kado-Fong et al. 2020; Bidaran et al. 2025). Interestingly, as shown in the bottom panel of the figure, dE01+09 has a similar radial velocity to the central galaxy of the group, yet it is situated in a region devoid of other non-star-forming galaxies. The presence of a quiescent dwarf in such an isolated environment is both unusual and noteworthy.
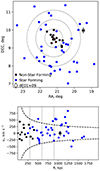 |
Fig. 1. Top: Spatial distribution of galaxies around NGC 524 from NED, within a velocity range of ±1000 km s−1 relative to the line-of-sight velocity of NGC 524. Star-forming and non-star-forming galaxies are shown in black and blue, respectively. The red dots represent massive (M* > 1010 M⊙) galaxies. The three concentric short-dashed circles indicate projected distances of one, two, and three times the group’s virial radius. The position of dE01+09 is highlighted with an open diamond symbol. Bottom: Phase-space diagram of galaxies around NGC 524. The thick dashed loci indicate the escape velocity profile of the group, assuming a total mass of 1013 M⊙. The vertical short-dashed lines denote one, two, and three times the group’s virial radius. |
3. Data analysis
3.1. Imaging
A view of dE01+09 in optical images is shown in Figure 2. The left panel presents a g–r–z color composite from the Legacy Survey. To better examine the low surface brightness component, we retrieved g-band CFHT/MegaCam data (500,s total exposure) from the CADC archive, which is shown in the left panel. The pre-processed Level 2 images, with 0.9″ seeing and 0.18″ pix−1 sampling, offer significantly higher quality than the Legacy data. As the target lies entirely on a single CCD chip, sky background subtraction (performed following Paudel et al. 2018) is straightforward despite the known mosaic-related issues with CFHT images.
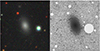 |
Fig. 2. dE01+09 as seen in Legacy Survey images. The left panel shows a g − r − z combined color image obtained from the Legacy Survey viewer tool. The right panel displays a grayscale CFHT g-band image with a field of view of 1.5′×1.5′. The color stretching was chosen to best reveal low surface brightness features, and unrelated background and foreground objects have been masked. |
We performed surface photometry on the CFHT MegaCam g-band image of dE01+09 using the IRAF ellipse task (Jedrzejewski 1987). Before fitting, we subtracted the sky background following the method in Paudel et al. (2023) and manually masked unrelated foreground and background objects. Elliptical isophotes were fitted with a fixed center and position angle, while allowing the ellipticity to vary. The center of the galaxy was determined using imcntr, and the input parameters were refined through iterative runs of ellipse.
In the top panel of Figure 3, we present the g − r color profile of dE01+09. The profile remains nearly flat within the uncertainties, with an average color of g − r ≃ 0.67 mag, as indicated by the horizontal dashed line. This uniform color suggests a relatively homogeneous stellar population throughout the galaxy and shows no evidence of recent central star formation. Such a flat profile contrasts with those of dEs located in the outskirts of the Virgo Cluster, where centrally concentrated star formation is commonly observed (Lisker et al. 2008; Urich et al. 2017). The lower panel of Figure 3 presents the g-band major-axis light profile of dE01+09, which shows a distinct break at ∼12″, suggesting a possible multi-component structure. A two-component Sérsic fit yields nin = 0.7 and nout = 0.4 with effective radii Re, in = 5″ and Re, out = 10″, respectively. For the global structural parameters, we fit a single Sérsic model to the entire light profile (excluding the central 2″ to avoid contamination from the nuclear light peak), obtaining n = 1.1 and Re = 1.2 kpc. These values are typical for dE galaxies with Mg ≃ −15.5 mag (Janz et al. 2014).
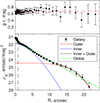 |
Fig. 3. Top: g − r color profile of dE01+09 along its major axis. The red dashed horizontal line indicates the overall g − r color. Bottom: g-band surface-brightness profile of dE01+09 measured along its major axis. The solid blue line represents the best-fitting inner Sérsic component, while the red line shows the outer Sérsic component, and the inner plus outer is plotted in black. The overall global best-fitting profile is shown in green. Uncertainties on the data points are indicated by the error bars. The vertical dashed line represents the radius of the DESI fiber. |
3.2. Spectroscopy
We retrieved the optical spectrum of dE01+09 from the DESI archive. As expected, the DESI fiber spectrum shows no Balmer emission lines. To maximize the information extracted, we performed full-spectrum fitting using the pPXF package (Cappellari & Emsellem 2004; Cappellari 2023), which employs a penalized likelihood method to match the observed spectrum with combinations of simple stellar populations (SSPs) defined by age and metallicity. We used templates from the E-MILES library (Vazdekis et al. 2016), restricting the fit to wavelengths below 5700 Å to minimize the sensitivity to the initial mass function. Given the relatively low signal-to-noise ratio, we smoothed the spectrum with a three-pixel Gaussian kernel before fitting4.
The quality of the model fit to the DESI spectrum is shown in Figure 4. The SSP age and metallicity (log[Z/Z⊙]) of dE01+09, derived from the DESI fiber spectroscopy, are 8.3 ± 1.4 Gyr and −1.18 ± 0.21 dex, respectively. The best-fitting radial velocity we obtained is 2374 ± 29 km s−1, which is similar to the reported value of radial velocity of dE01+09 by the DESI DR1 catalog. It should be noted that the DESI fiber spectrum samples only the central 1.5″ region of the galaxy; therefore, the derived stellar population properties pertain to its central region. Following the approach recommended by Cappellari (2023), we estimated the uncertainties in age and metallicity using a bootstrap analysis, similar to the method of Kacharov et al. (2018) and as described on the pPXF example pages. For each science spectrum, we generated 100 Monte Carlo realizations by adding noise drawn from the residuals of the best-fitting model. Each realization was refitted with the same pPXF setup, and the resulting distributions of light-weighted age and metallicity were used to determine the corresponding 1σ uncertainties.
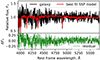 |
Fig. 4. Top: DESI fiber spectrum of dE01+09 (black) overlaid with the best-fitting simple stellar population (SSP) model spectrum (red). Bottom: Residuals (green), defined as the difference between the observed and model spectra. The fit reproduces the observed flux to within approximately 10%, as indicated by the horizontal dashed lines. |
4. Conclusions and discussion
We identified a rare dE, dE01+09, located in a nearly isolated environment at a sky-projected distance of 1.2 Mpc from its nearest group, NGC 524. dE01+09 exhibits typical morphological and stellar population characteristics of a dE. Given the current data and the rarity of low-mass quenched galaxies similar to dE01+09 in the field, we argue that dE01+09 is more likely a runaway or backsplash candidate than a true field galaxy.
In this scenario, dE01+09 may have entered the group several gigayears ago as a star-forming dwarf, where it experienced environmental quenching, likely via a combination of ram-pressure stripping and tidal interactions, approximately 8.3 Gyr ago, as we expect from its SSP age. After quenching, it continued to orbit within the group potential for several gigayears. Roughly 3.5 Gyr ago, a strong dynamical interaction, possibly involving a three-body encounter, imparted a velocity near the group’s escape speed (vesc ≃ 300 km s−1 in the plane of the sky) and ejected the galaxy beyond the virial radius. At the present epoch dE01+09 lies at least 1.2 Mpc in projection from the group center, is quiescent, and may be deficient in dark matter, as suggested by analogous cases in simulations Mitrašinović et al. (2023).
While high-velocity ejections are more common in massive clusters (M ≈1014 − 1015 M⊙), numerical studies demonstrate that backsplash and even unbound orbits also occur in group environments (M ≈1013 M⊙) when orbital resonances or close multi-body encounters transfer sufficient energy to satellites (Wetzel et al. 2014; Levis et al. 2025). The escape velocity of the NGC 524 group (∼300 km s−1) is comparable to that required to unbind a low-mass dwarf, and thus makes the proposed scenario dynamically plausible despite the group’s lower velocity dispersion. This scenario is limited by the lack of direct constraints on the three-dimensional positions and velocities of dE01+09 and NGC 524, making the ejection timescale and trajectory uncertain.
Our findings align with results from Benavides et al. (2021), who used the TNG50 simulation to trace backsplash galaxies in both groups and clusters. They find that in groups, quenched ultra diffuse galaxies with stellar masses similar to dE01+09 can be found as far as ∼3 R2000 from the group or cluster center, with a smaller fraction reaching ∼3.5 R2000, the current projected separation of our target. This suggests that dE01+09 represents an extreme but still plausible outcome of group dynamical evolution.
An isolated galaxy is typically defined as a dwarf galaxy located at least 500 kpc from a massive galaxy, with a line-of-sight relative velocity greater than 500 km s−1 (Paudel et al. 2014; Kado-Fong et al. 2020; Bidaran et al. 2025).
This distance is based on the assumed distance to NGC 524 of 34.2 Mpc from us, derived from the Hubble flow using a cosmology with H0 = 71 and Ωm = 0.3.
The virial radius is calculated for a halo mass of 1013 M⊙, which we derived using the projected group mass equation provided by Heisler et al. (1985).
The DESI blue-channel spectrum has an average resolving power of R ≈ 2000 (FWHM ≈1.8 Å) with a sampling of 0.8 Å pix−1. Applying a three-pixel Gaussian smoothing yields a final resolution of R ≈ 1746 (FWHM ≈ 2.9 Å) at a rest-frame wavelength of 5000 Å.
References
- Benavides, J. A., Sales, L. V., Abadi, M. G., et al. 2021, Nat. Astron., 5, 1255 [NASA ADS] [CrossRef] [Google Scholar]
- Bidaran, B., Pérez, I., Sánchez-Menguiano, L., et al. 2025, A&A, 693, L16 [NASA ADS] [CrossRef] [EDP Sciences] [Google Scholar]
- Binggeli, B., Sandage, A., & Tammann, G. A. 1988, ARA&A, 26, 509 [NASA ADS] [CrossRef] [Google Scholar]
- Borrow, J., Vogelsberger, M., O’Neil, S., McDonald, M. A., & Smith, A. 2023, MNRAS, 520, 649 [NASA ADS] [CrossRef] [Google Scholar]
- Boselli, A., & Gavazzi, G. 2006, PASP, 118, 517 [Google Scholar]
- Cappellari, M. 2023, MNRAS, 526, 3273 [NASA ADS] [CrossRef] [Google Scholar]
- Cappellari, M., & Emsellem, E. 2004, PASP, 116, 138 [Google Scholar]
- Chilingarian, I., & Zolotukhin, I. 2015, Science, 348, 418 [NASA ADS] [CrossRef] [Google Scholar]
- Cortese, L., Catinella, B., & Smith, R. 2021, PASA, 38, e035 [NASA ADS] [CrossRef] [Google Scholar]
- Croton, D. J., Springel, V., White, S. D. M., et al. 2006, MNRAS, 365, 11 [Google Scholar]
- DESI Collaboration (Abdul-Karim, M., et al.) 2025, AJ, submitted [arXiv:2503.14745] [Google Scholar]
- Gill, S. P. D., Knebe, A., & Gibson, B. K. 2005, MNRAS, 356, 1327 [CrossRef] [Google Scholar]
- Gunn, J. E., & Gott, J. R. I. 1972, ApJ, 176, 1 [Google Scholar]
- Heisler, J., Tremaine, S., & Bahcall, J. N. 1985, ApJ, 298, 8 [CrossRef] [Google Scholar]
- Hopkins, P. F., Quataert, E., & Murray, N. 2012, MNRAS, 421, 3522 [Google Scholar]
- Janz, J., Laurikainen, E., Lisker, T., et al. 2014, ApJ, 786, 105 [Google Scholar]
- Janz, J., Penny, S. J., Graham, A. W., Forbes, D. A., & Davies, R. L. 2017, MNRAS, 468, 2850 [Google Scholar]
- Jedrzejewski, R. I. 1987, MNRAS, 226, 747 [Google Scholar]
- Kacharov, N., Neumayer, N., Seth, A. C., et al. 2018, MNRAS, 480, 1973 [Google Scholar]
- Kado-Fong, E., Greene, J. E., Greco, J. P., et al. 2020, AJ, 159, 103 [NASA ADS] [CrossRef] [Google Scholar]
- Kenney, J. D. P., van Gorkom, J. H., & Vollmer, B. 2004, AJ, 127, 3361 [Google Scholar]
- Kenney, J. D. P., Geha, M., Jáchym, P., et al. 2014, ApJ, 780, 119 [Google Scholar]
- Larson, R. B., Tinsley, B. M., & Caldwell, C. N. 1980, ApJ, 237, 692 [Google Scholar]
- Levis, S., Coenda, V., Muriel, H., et al. 2025, A&A, 698, A57 [NASA ADS] [CrossRef] [EDP Sciences] [Google Scholar]
- Lisker, T., Grebel, E. K., Binggeli, B., & Glatt, K. 2007, ApJ, 660, 1186 [Google Scholar]
- Lisker, T., Grebel, E. K., & Binggeli, B. 2008, AJ, 135, 380 [Google Scholar]
- Mayer, L., Governato, F., Colpi, M., et al. 2001, ApJ, 559, 754 [NASA ADS] [CrossRef] [Google Scholar]
- Mitrašinović, A., Smole, M., & Micic, M. 2023, A&A, 680, L1 [NASA ADS] [CrossRef] [EDP Sciences] [Google Scholar]
- Moore, B., Katz, N., Lake, G., Dressler, A., & Oemler, A. 1996, Nature, 379, 613 [Google Scholar]
- Paudel, S., Lisker, T., Hansson, K. S. A., & Huxor, A. P. 2014, MNRAS, 443, 446 [NASA ADS] [CrossRef] [Google Scholar]
- Paudel, S., Smith, R., Yoon, S. J., Calderón-Castillo, P., & Duc, P.-A. 2018, ApJS, 237, 36 [Google Scholar]
- Paudel, S., Yoon, S.-J., Yoo, J., et al. 2023, ApJS, 265, 57 [NASA ADS] [CrossRef] [Google Scholar]
- Pimbblet, K. A. 2011, MNRAS, 411, 2637 [NASA ADS] [CrossRef] [Google Scholar]
- Simpson, C. M., Grand, R. J. J., Gómez, F. A., et al. 2018, MNRAS, 478, 548 [CrossRef] [Google Scholar]
- Smith, R., Davies, J. I., & Nelson, A. H. 2010, MNRAS, 405, 1723 [NASA ADS] [Google Scholar]
- Urich, L., Lisker, T., Janz, J., et al. 2017, A&A, 606, A135 [NASA ADS] [CrossRef] [EDP Sciences] [Google Scholar]
- Vazdekis, A., Koleva, M., Ricciardelli, E., Röck, B., & Falcón-Barroso, J. 2016, MNRAS, 463, 3409 [Google Scholar]
- Vollmer, B., Cayatte, V., Balkowski, C., & Duschl, W. J. 2001, ApJ, 561, 708 [NASA ADS] [CrossRef] [Google Scholar]
- Wetzel, A. R., Tinker, J. L., Conroy, C., & van den Bosch, F. C. 2014, MNRAS, 439, 2687 [NASA ADS] [CrossRef] [Google Scholar]
- Zhang, Y., & Bell, E. F. 2017, ApJ, 835, L2 [Google Scholar]
Appendix A: Image classification
To identify dEs in large imaging surveys, we employed MobileNetV2, a lightweight convolutional neural network (CNN) optimized for efficient image classification. We retrained the model using our previously compiled catalog of 5,000 visually confirmed dEs as the training set. For the input data, we generated image cutouts from the Legacy Survey in the gri bands, centered on each galaxy and resized to 300 × 300 pixels to capture relevant morphological features while maintaining computational efficiency. The retrained MobileNetV2 achieves a classification accuracy of 87 %, with a precision of 83 % and a recall of 79 % for the dE class on a held-out validation set.
The trained MobileNetV2 model is then applied to classify a new sample of 22,000 galaxies at redshift z < 0.01, drawn from the DESI DR1 imaging catalog. During inference, the model assigns probabilities for each galaxy belonging to the dE class based on features such as a smooth light distribution, compactness, and the absence of star-forming structures. An example output from our automated classification is shown in Figure A.1. The complete analysis, along with a full catalog of newly spectroscopically confirmed dEs, will be presented in a forthcoming publication.
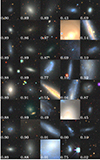 |
Fig. A.1. Classification of galaxies using the retrained MobileNetV2 model. Each panel shows a galaxy image along with its predicted probability of being a dE. As expected, the model assigns the highest probabilities to galaxies with the smooth morphological characteristics typical of dEs, while the probability decreases for galaxies whose visual appearance diverges from these features. |
Appendix B: Acknowledgements
Acknowledgments. SP and SJY acknowledge support from the Mid-career Researcher Program (RS-2023-00208957 and RS-2024-00344283, respectively) through Korea’s National Research Foundation (NRF). SJY and CGS acknowledge support from the Basic Science Research Program (2022R1A6A1A03053472 and 2018R1A6A1A06024977, respectively) through Korea’s NRF funded by the Ministry of Education. The DESI Legacy Imaging Surveys consist of three individual and complementary projects: the Dark Energy Camera Legacy Survey (DECaLS), the Beijing-Arizona Sky Survey (BASS), and the Mayall z-band Legacy Survey (MzLS). DECaLS, BASS and MzLS together include data obtained, respectively, at the Blanco telescope, Cerro Tololo Inter-American Observatory, NSF’s NOIRLab; the Bok telescope, Steward Observatory, University of Arizona; and the Mayall telescope, Kitt Peak National Observatory, NOIRLab. NOIRLab is operated by the Association of Universities for Research in Astronomy (AURA) under a cooperative agreement with the National Science Foundation. Pipeline processing and analyses of the data were supported by NOIRLab and the Lawrence Berkeley National Laboratory (LBNL). Legacy Surveys also uses data products from the Near-Earth Object Wide-field Infrared Survey Explorer (NEOWISE), a project of the Jet Propulsion Laboratory/California Institute of Technology, funded by the National Aeronautics and Space Administration. Legacy Surveys was supported by: the Director, Office of Science, Office of High-Energy Physics of the U.S. Department of Energy; the National Energy Research Scientific Computing Center, a DOE Office of Science User Facility; the U.S. National Science Foundation, Division of Astronomical Sciences; the National Astronomical Observatories of China, the Chinese Academy of Sciences and the Chinese National Natural Science Foundation. LBNL is managed by the Regents of the University of California under contract to the U.S. Department of Energy. The complete acknowledgments can be found at https://www.legacysurvey.org/acknowledgment/. This research used data obtained with the Dark Energy Spectroscopic Instrument (DESI). DESI construction and operations is managed by the Lawrence Berkeley National Laboratory. This material is based upon work supported by the U.S. Department of Energy, Office of Science, Office of High-Energy Physics, under Contract No. DE–AC02–05CH11231, and by the National Energy Research Scientific Computing Center, a DOE Office of Science User Facility under the same contract. Additional support for DESI was provided by the U.S. National Science Foundation (NSF), Division of Astronomical Sciences under Contract No. AST-0950945 to the NSF’s National Optical-Infrared Astronomy Research Laboratory; the Science and Technology Facilities Council of the United Kingdom; the Gordon and Betty Moore Foundation; the Heising-Simons Foundation; the French Alternative Energies and Atomic Energy Commission (CEA); the National Council of Science and Technology of Mexico (CONACYT); the Ministry of Science and Innovation of Spain (MICINN), and by the DESI Member Institutions: www.desi.lbl.gov/collaborating-institutions. The DESI collaboration is honored to be permitted to conduct scientific research on Iolkam Du’ag (Kitt Peak), a mountain with particular significance to the Tohono O’odham Nation. Any opinions, findings, and conclusions or recommendations expressed in this material are those of the author(s) and do not necessarily reflect the views of the U.S. National Science Foundation, the U.S. Department of Energy, or any of the listed funding agencies.
All Tables
All Figures
|
Fig. 1. Top: Spatial distribution of galaxies around NGC 524 from NED, within a velocity range of ±1000 km s−1 relative to the line-of-sight velocity of NGC 524. Star-forming and non-star-forming galaxies are shown in black and blue, respectively. The red dots represent massive (M* > 1010 M⊙) galaxies. The three concentric short-dashed circles indicate projected distances of one, two, and three times the group’s virial radius. The position of dE01+09 is highlighted with an open diamond symbol. Bottom: Phase-space diagram of galaxies around NGC 524. The thick dashed loci indicate the escape velocity profile of the group, assuming a total mass of 1013 M⊙. The vertical short-dashed lines denote one, two, and three times the group’s virial radius. |
| In the text | |
|
Fig. 2. dE01+09 as seen in Legacy Survey images. The left panel shows a g − r − z combined color image obtained from the Legacy Survey viewer tool. The right panel displays a grayscale CFHT g-band image with a field of view of 1.5′×1.5′. The color stretching was chosen to best reveal low surface brightness features, and unrelated background and foreground objects have been masked. |
| In the text | |
|
Fig. 3. Top: g − r color profile of dE01+09 along its major axis. The red dashed horizontal line indicates the overall g − r color. Bottom: g-band surface-brightness profile of dE01+09 measured along its major axis. The solid blue line represents the best-fitting inner Sérsic component, while the red line shows the outer Sérsic component, and the inner plus outer is plotted in black. The overall global best-fitting profile is shown in green. Uncertainties on the data points are indicated by the error bars. The vertical dashed line represents the radius of the DESI fiber. |
| In the text | |
|
Fig. 4. Top: DESI fiber spectrum of dE01+09 (black) overlaid with the best-fitting simple stellar population (SSP) model spectrum (red). Bottom: Residuals (green), defined as the difference between the observed and model spectra. The fit reproduces the observed flux to within approximately 10%, as indicated by the horizontal dashed lines. |
| In the text | |
|
Fig. A.1. Classification of galaxies using the retrained MobileNetV2 model. Each panel shows a galaxy image along with its predicted probability of being a dE. As expected, the model assigns the highest probabilities to galaxies with the smooth morphological characteristics typical of dEs, while the probability decreases for galaxies whose visual appearance diverges from these features. |
| In the text | |
Current usage metrics show cumulative count of Article Views (full-text article views including HTML views, PDF and ePub downloads, according to the available data) and Abstracts Views on Vision4Press platform.
Data correspond to usage on the plateform after 2015. The current usage metrics is available 48-96 hours after online publication and is updated daily on week days.
Initial download of the metrics may take a while.