Fig. 2.
Download original image
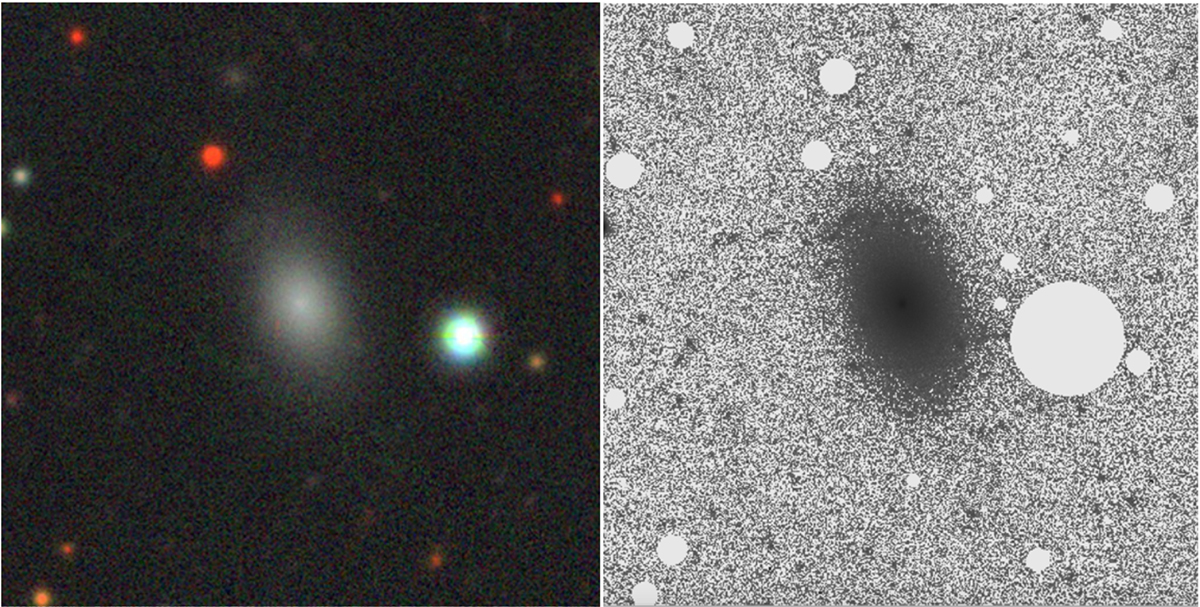
dE01+09 as seen in Legacy Survey images. The left panel shows a g − r − z combined color image obtained from the Legacy Survey viewer tool. The right panel displays a grayscale CFHT g-band image with a field of view of 1.5′×1.5′. The color stretching was chosen to best reveal low surface brightness features, and unrelated background and foreground objects have been masked.
Current usage metrics show cumulative count of Article Views (full-text article views including HTML views, PDF and ePub downloads, according to the available data) and Abstracts Views on Vision4Press platform.
Data correspond to usage on the plateform after 2015. The current usage metrics is available 48-96 hours after online publication and is updated daily on week days.
Initial download of the metrics may take a while.