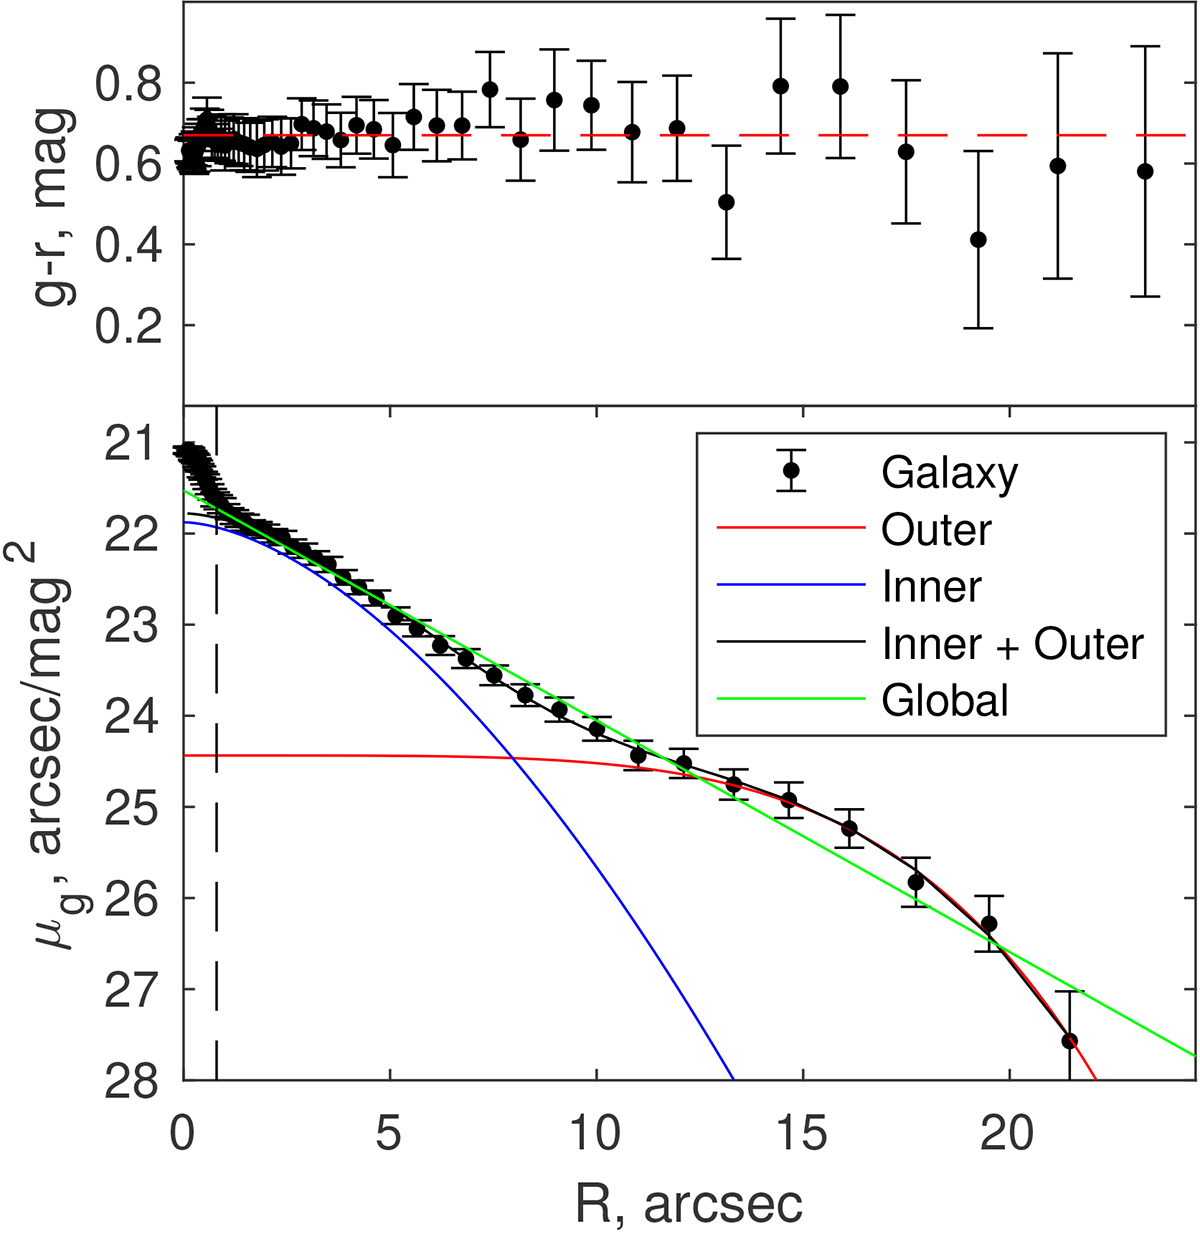
Fig. 3.
Download original image
Top: g − r color profile of dE01+09 along its major axis. The red dashed horizontal line indicates the overall g − r color. Bottom: g-band surface-brightness profile of dE01+09 measured along its major axis. The solid blue line represents the best-fitting inner Sérsic component, while the red line shows the outer Sérsic component, and the inner plus outer is plotted in black. The overall global best-fitting profile is shown in green. Uncertainties on the data points are indicated by the error bars. The vertical dashed line represents the radius of the DESI fiber.
Current usage metrics show cumulative count of Article Views (full-text article views including HTML views, PDF and ePub downloads, according to the available data) and Abstracts Views on Vision4Press platform.
Data correspond to usage on the plateform after 2015. The current usage metrics is available 48-96 hours after online publication and is updated daily on week days.
Initial download of the metrics may take a while.