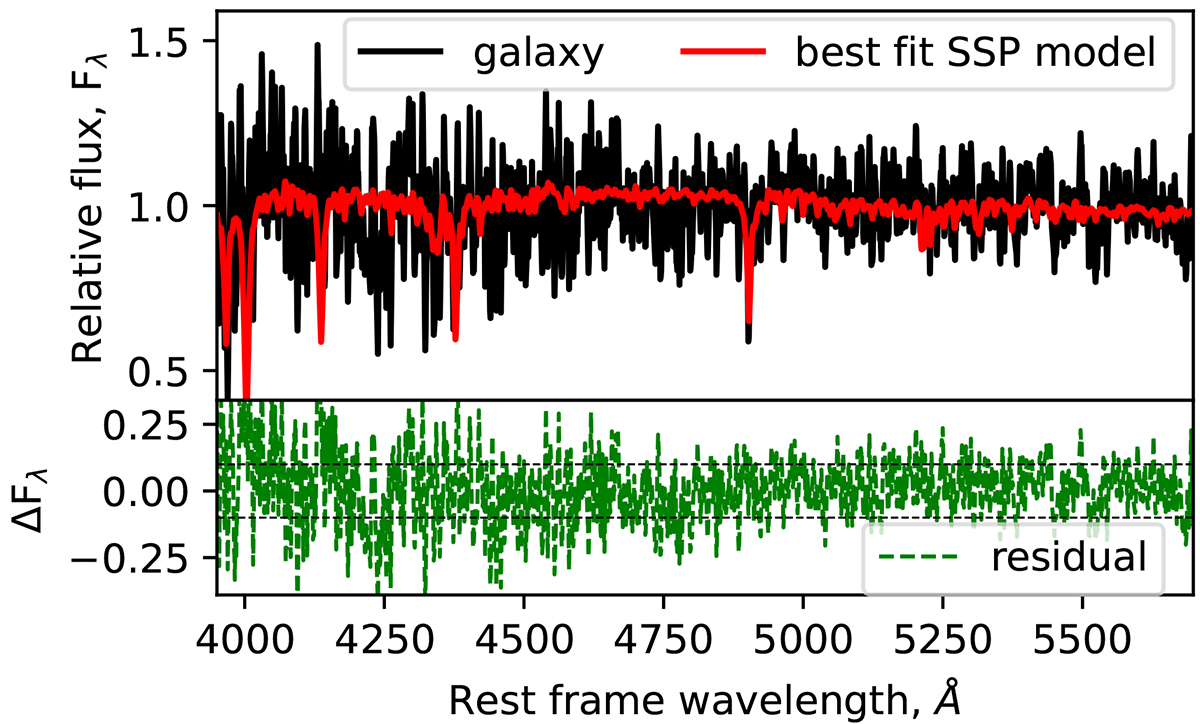
Fig. 4.
Download original image
Top: DESI fiber spectrum of dE01+09 (black) overlaid with the best-fitting simple stellar population (SSP) model spectrum (red). Bottom: Residuals (green), defined as the difference between the observed and model spectra. The fit reproduces the observed flux to within approximately 10%, as indicated by the horizontal dashed lines.
Current usage metrics show cumulative count of Article Views (full-text article views including HTML views, PDF and ePub downloads, according to the available data) and Abstracts Views on Vision4Press platform.
Data correspond to usage on the plateform after 2015. The current usage metrics is available 48-96 hours after online publication and is updated daily on week days.
Initial download of the metrics may take a while.