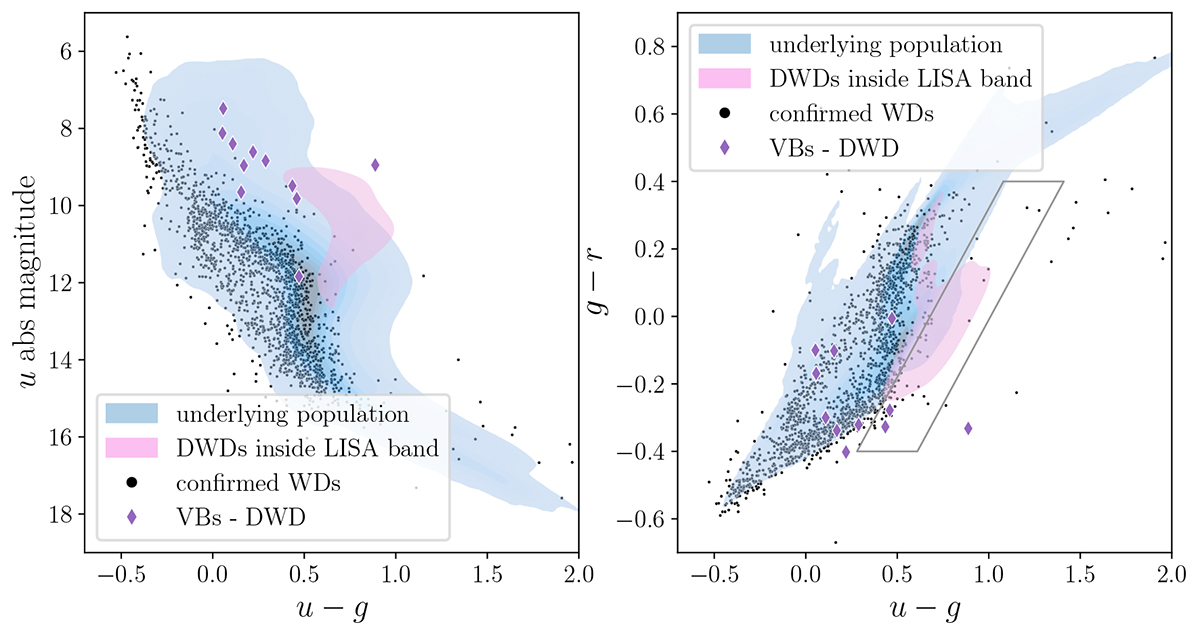
Fig. 3.
Download original image
Density distribution in magnitude-colour (left) and colour-colour space (right) of our synthetic catalogue highlighting potential LISA sources (magenta) with respect to the rest of the remaining systems (blue). The black points are confirmed WD observations, while purple markers are detached DWD VBs. We note that several VBs fall directly in the magenta area when reddening is removed and a more stringent magnitude limit is applied. On the right, the grey lines define the colour cuts used in our analysis.
Current usage metrics show cumulative count of Article Views (full-text article views including HTML views, PDF and ePub downloads, according to the available data) and Abstracts Views on Vision4Press platform.
Data correspond to usage on the plateform after 2015. The current usage metrics is available 48-96 hours after online publication and is updated daily on week days.
Initial download of the metrics may take a while.