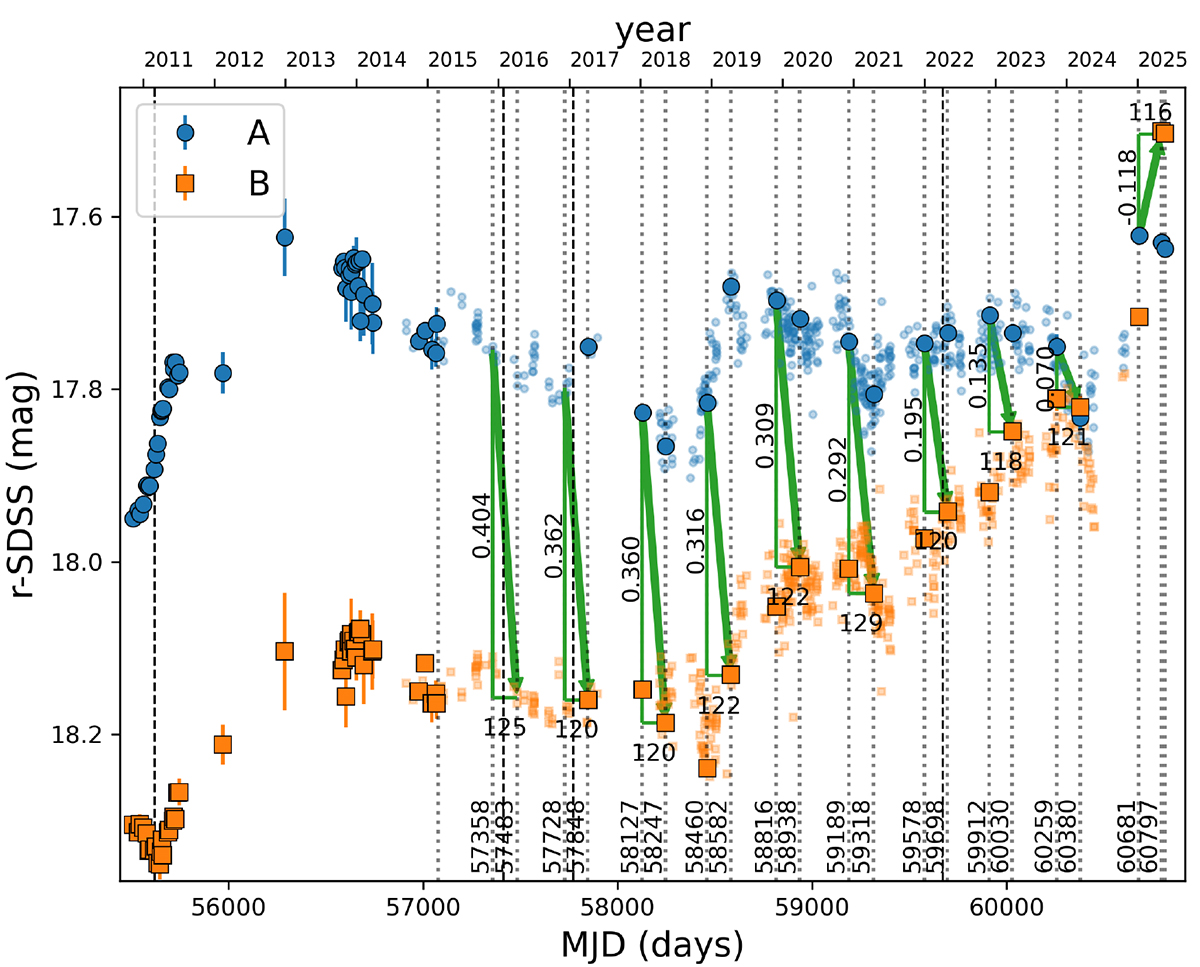
Fig. 1.
Download original image
Light curves of SDSS J1001+5027 in the r band and 29 spectroscopic epochs. The large circles/squares with black borders represent LT-HCT-PS magnitudes, while the small semi-transparent circles and squares describe Gaia-ZTF magnitudes (see main text for details). The vertical dotted lines show 25 epochs of spectroscopic observations with LT/SPRAT, leading to ten pairs of AB spectra separated by the time delay of the system (green arrows and horizontal green bars). For these AB pairs, the r-band magnitude offsets are highlighted with vertical green bars. The dashed vertical lines show four epochs of auxiliary spectroscopy (see Appendix B).
Current usage metrics show cumulative count of Article Views (full-text article views including HTML views, PDF and ePub downloads, according to the available data) and Abstracts Views on Vision4Press platform.
Data correspond to usage on the plateform after 2015. The current usage metrics is available 48-96 hours after online publication and is updated daily on week days.
Initial download of the metrics may take a while.