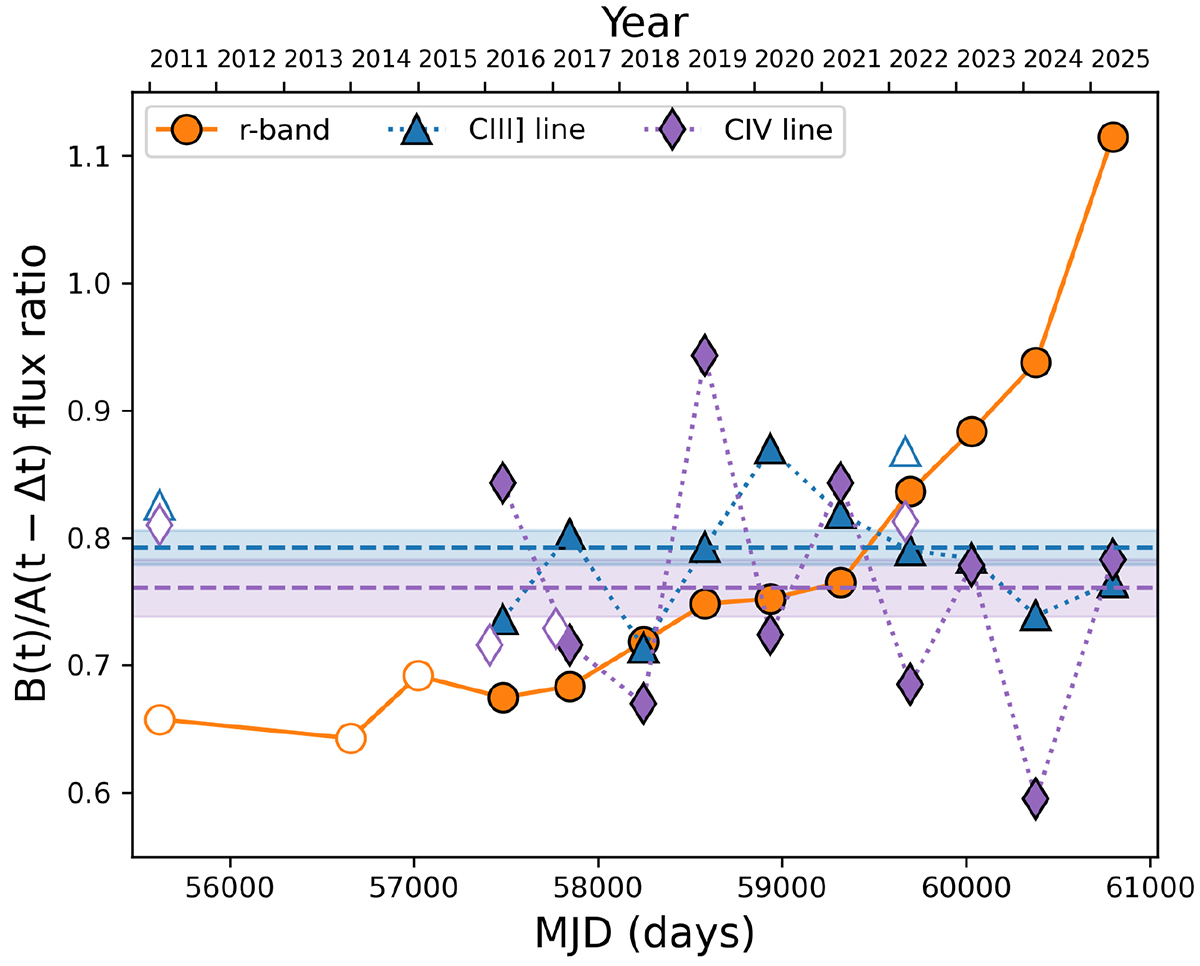
Fig. 4.
Download original image
Flux ratios for the cores of the C IV and C III] emission lines. The filled purple diamonds and filled blue triangles represent delay-corrected C IV and C III] line-core flux ratios, respectively, and the horizontal dashed lines and strips describe the average values and their uncertainties (purple for C IV and blue for C III]). The open purple diamonds (C IV) and open blue triangles (C III]) represent single-epoch measurements from auxiliary spectra (see Appendix B). For comparison, we also show the long-term evolution of the delay-corrected r-band flux ratio (filled circles), along with a few single-epoch values before 2016 (open circles).
Current usage metrics show cumulative count of Article Views (full-text article views including HTML views, PDF and ePub downloads, according to the available data) and Abstracts Views on Vision4Press platform.
Data correspond to usage on the plateform after 2015. The current usage metrics is available 48-96 hours after online publication and is updated daily on week days.
Initial download of the metrics may take a while.