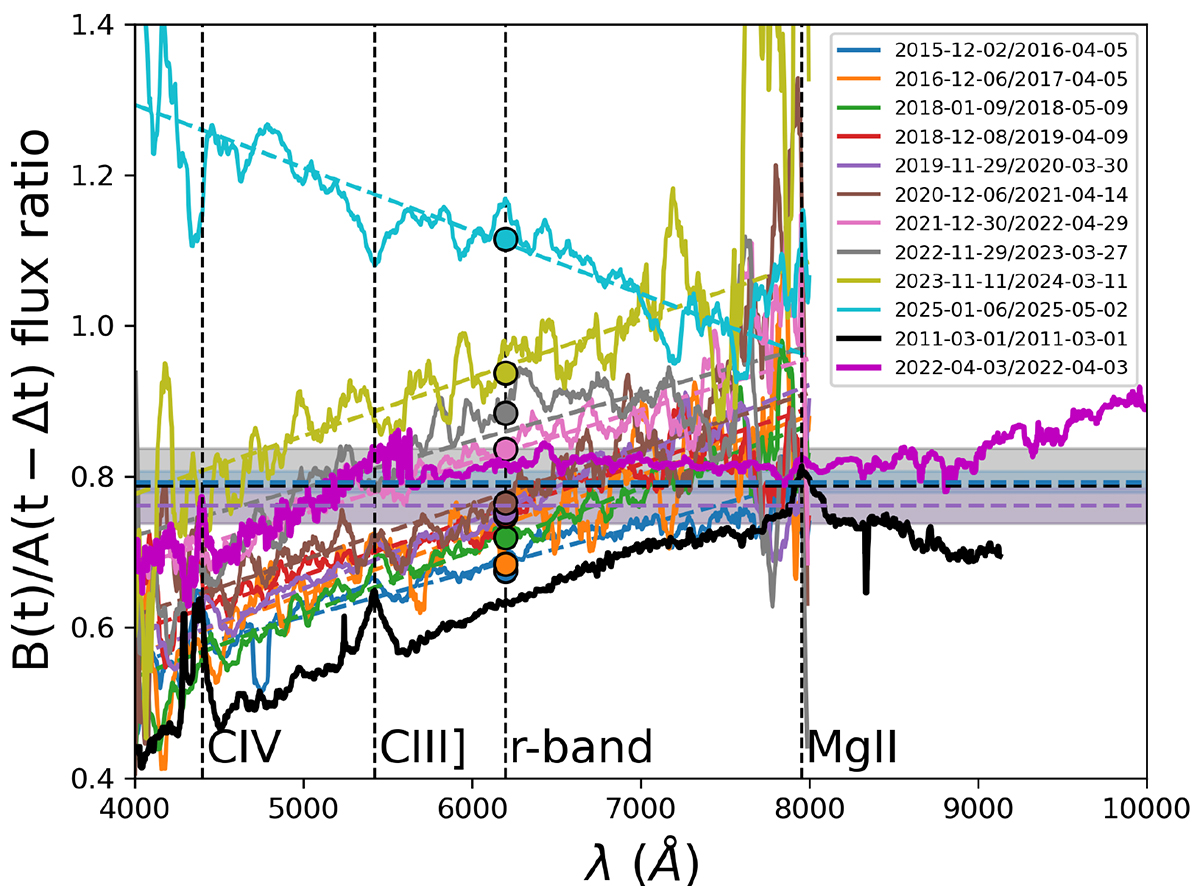
Fig. 5.
Download original image
Delay-corrected spectral flux ratio of SDSS J1001+5027. The delay-corrected r-band flux ratio (filled circles), and the single-epoch spectral flux ratio from Gemini North/GMOS (black line) and Keck/LRIS (deep purple line) are also shown. The three horizontal strips correspond to the C IV (purple), C III] (blue), and K-band (grey) flux ratios (see the end of Section 4.1), and are used to highlight the macrolens flux ratio.
Current usage metrics show cumulative count of Article Views (full-text article views including HTML views, PDF and ePub downloads, according to the available data) and Abstracts Views on Vision4Press platform.
Data correspond to usage on the plateform after 2015. The current usage metrics is available 48-96 hours after online publication and is updated daily on week days.
Initial download of the metrics may take a while.