Open Access
Fig. A.2.
Download original image
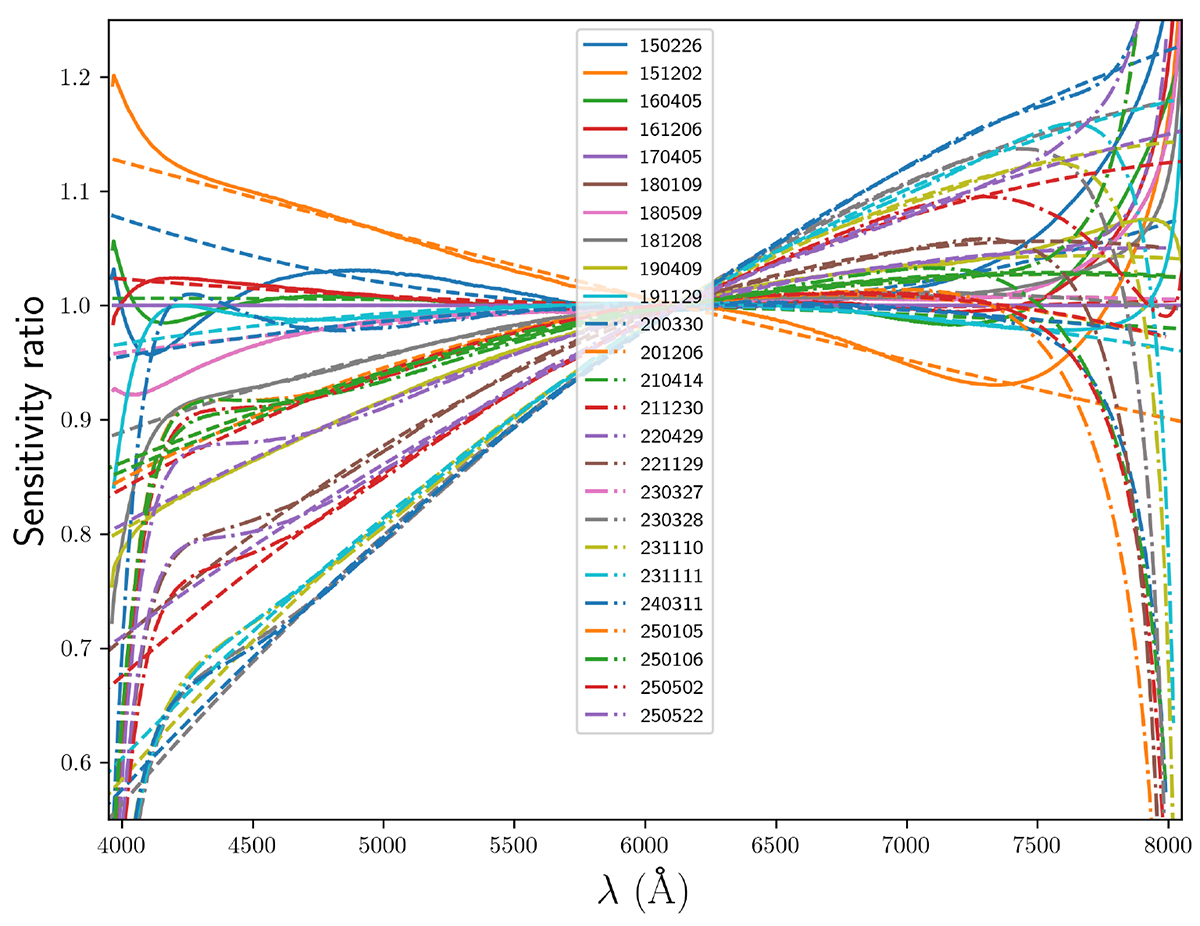
Normalised relative responses (see main text). The dashed lines are second-degree polynomial fits to the normalised relative responses in the central spectral region (4500–7500 Å), which are extrapolated to both spectral edges.
Current usage metrics show cumulative count of Article Views (full-text article views including HTML views, PDF and ePub downloads, according to the available data) and Abstracts Views on Vision4Press platform.
Data correspond to usage on the plateform after 2015. The current usage metrics is available 48-96 hours after online publication and is updated daily on week days.
Initial download of the metrics may take a while.