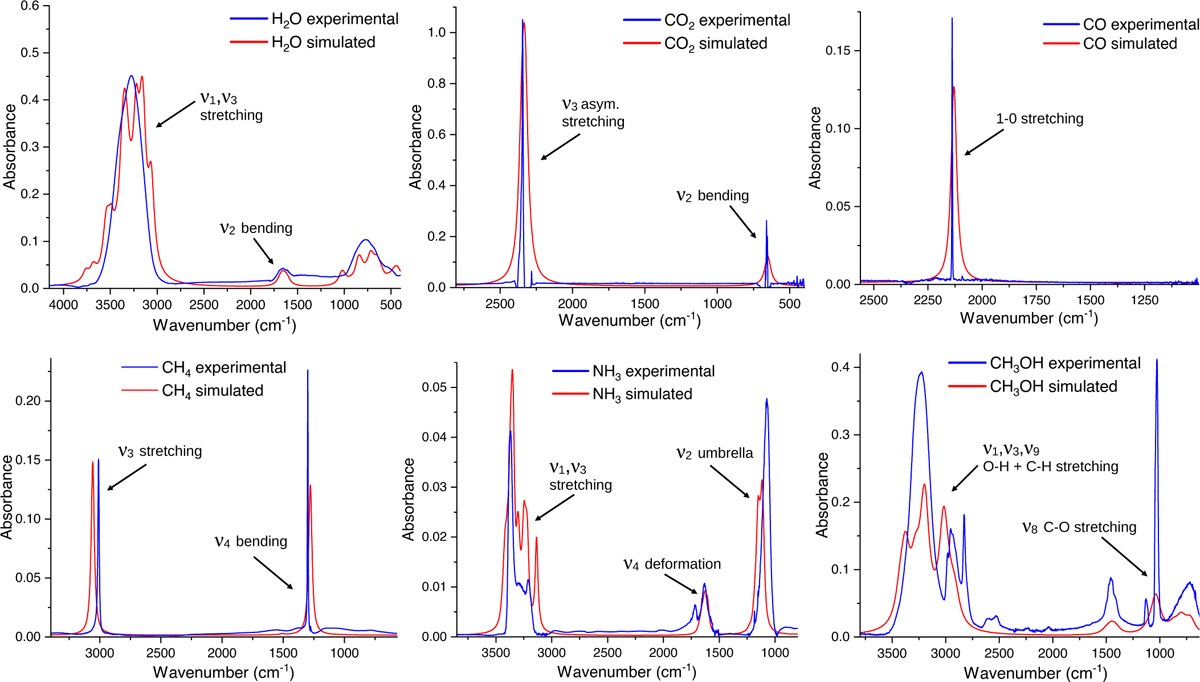
Fig. 3
Download original image
Comparisons between DFT-simulated IR spectra and laboratory experimental spectra. All ice samples shown were deposited at 10 K; simulations were thermalised with MD with a thermostat at 10 K. Minor disagreements in band positions are caused by potential differences in density estimations, which are experimentally uncertain. Simulated spectra are represented as Lorentzian curves with a full width at half maximum of 25 cm−1. Absorbance intensities have been normalised for clarity. Source data for all spectra are provided as supplemental material.
Current usage metrics show cumulative count of Article Views (full-text article views including HTML views, PDF and ePub downloads, according to the available data) and Abstracts Views on Vision4Press platform.
Data correspond to usage on the plateform after 2015. The current usage metrics is available 48-96 hours after online publication and is updated daily on week days.
Initial download of the metrics may take a while.