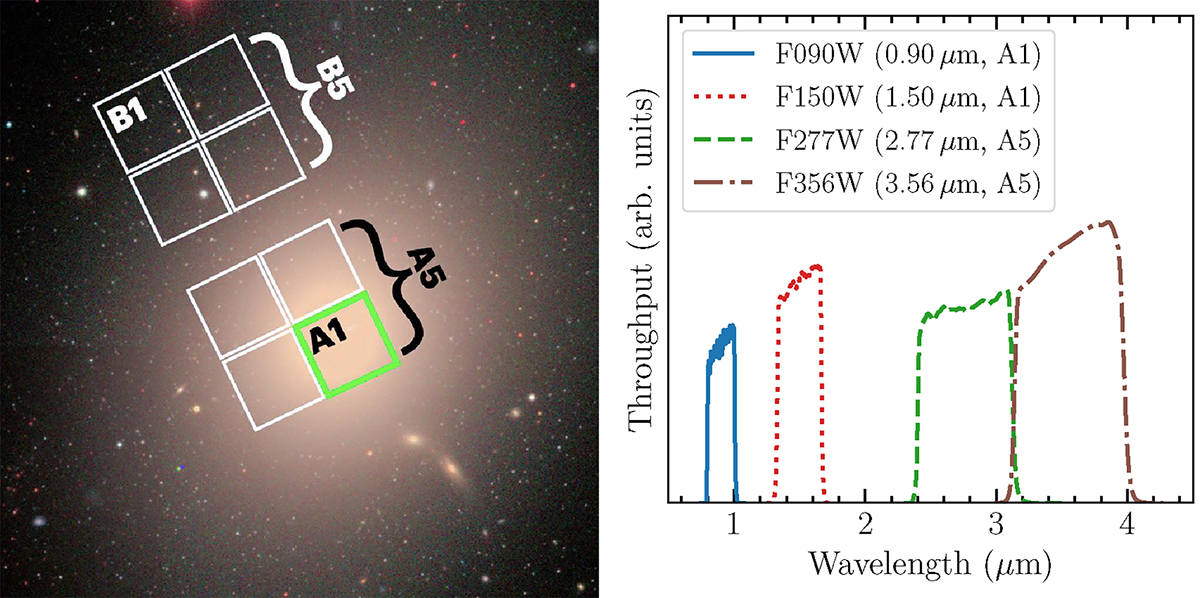
Fig. 1.
Download original image
Left: NIRCam footprint on M87 (Anand et al. 2025). The green sub-square represents the A1 detector footprint for the F090W and F150W images in this study; F277W and F356W images are taken with the lower-right half of the NIRCam footprint (detector A5). The background image was created using the online SDSS mosaic tool. Right: Detector throughputs and wavelength ranges for the four NIRCam filters used. Characteristic wavelengths are indicated in the legend.
Current usage metrics show cumulative count of Article Views (full-text article views including HTML views, PDF and ePub downloads, according to the available data) and Abstracts Views on Vision4Press platform.
Data correspond to usage on the plateform after 2015. The current usage metrics is available 48-96 hours after online publication and is updated daily on week days.
Initial download of the metrics may take a while.