| Issue |
A&A
Volume 701, September 2025
|
|
|---|---|---|
| Article Number | L12 | |
| Number of page(s) | 7 | |
| Section | Letters to the Editor | |
| DOI | https://doi.org/10.1051/0004-6361/202556577 | |
| Published online | 22 September 2025 | |
Letter to the Editor
The infrared jet of M87 observed with JWST
1
Instituto de Astrofísica de Andalucía, Gta. de la Astronomía, 18008 Granada, Spain
2
Department of Physics, Utah Valley University, 800 West University Parkway, Orem, UT 84058, USA
3
Space Telescope Science Institute, 3700 San Martin Drive, Baltimore, MD 21218, USA
4
Institute for Astronomy, University of Hawaii, 2680 Woodlawn Drive, Honolulu, HI 96822, USA
⋆ Corresponding author: contact@janroeder.science
Received:
24
July
2025
Accepted:
6
September
2025
Abstract
Aims. We present the first JWST+NIRCam images of the giant elliptical active galaxy M87 and its jet at 0.90, 1.50, 2.77, and 3.56 μm. We analysed the large-scale jet structure, identifying prominent components, and we determined the near-infrared spectral index.
Methods. The data were calibrated using the standard JWST pipeline. We subtracted a constant background level and a smooth model of the galaxy surface brightness to isolate the jet.
Results. The total image fluxes measured in the NIRCam filters follow the infrared bump pattern seen near 1.6 μm in the spectrum of M87, caused by the surrounding stellar population in the galaxy. The residual jet images broadly agree with the radio to optical synchrotron power law of Sλ ∝ λα with α = 0.7 − 1.0. We identified the most upstream knot, L, at a distance of (320 ± 50) mas from the core. The component HST-1, located at (950 ± 50) mas from the core, is transversely resolved. Both the individual images and the spectral index map clearly indicate its double-component substructure with two elements of a similar size and flux density, with centroids separated by (150 ± 20) mas. In addition, it displays a significantly larger spectral index, α, observed in the downstream component (αdo = 0.30) compared to the upstream one (αup = −0.15). We also observed the counter-jet component located about 24 arcsec away from the nucleus.
Key words: radiation mechanisms: non-thermal / galaxies: active / galaxies: individual: M87 / galaxies: jets / infrared: galaxies / infrared: general
© The Authors 2025
 Open Access article, published by EDP Sciences, under the terms of the Creative Commons Attribution License (https://creativecommons.org/licenses/by/4.0), which permits unrestricted use, distribution, and reproduction in any medium, provided the original work is properly cited.
This article is published in open access under the Subscribe to Open model. This email address is being protected from spambots. You need JavaScript enabled to view it. to support open access publication.
1. Introduction
As one of the most intensely studied objects in the sky, the giant elliptical galaxy M87 (Messier 1781) boasts an extensive history (for a review see e.g. Hada et al. 2024). The prominent one-sided jet, discovered just over a century ago (Curtis 1918), was eventually found to be polarised (Baade 1956), leading to the initial conclusion that synchrotron radiation must be the dominant emission mechanism at optical wavelengths.
The M87 jet has since served as a prime laboratory for the science of active galactic nuclei (AGNs). Since M87 is a strong radio source, many studies of its jet at various spatial scales have been carried out at radio wavelengths (e.g. Baldwin & Smith 1956; Reid et al. 1989; Lobanov et al. 2003; Kovalev et al. 2007; Chang et al. 2010; Mertens et al. 2016; Britzen et al. 2017; Kim et al. 2018; Punsly 2023; Cui et al. 2023; Nikonov et al. 2023), even going as far as resolving the central supermassive black hole at its core (EHTC et al. 2019, 2024; Lu et al. 2023; Kim et al. 2025). Many other studies have examined the optical emission (e.g. Boksenberg et al. 1992; Perlman et al. 1999, 2001, 2003; Meyer et al. 2013), UV radiation (Madrid et al. 2007; Lessing et al. 2024), X-rays (e.g. Schreier et al. 1982; Marshall et al. 2002; Snios et al. 2019), and γ-rays (H.E.S.S. Collaboration 2024). The multi-band emission was studied by Harris et al. (2009), Prieto et al. (2016), and EHT MWL WG et al. (2021), EHT MWL WG et al. (2024).
Previous optical and infrared studies have reported that the radio-to-optical spectrum in the kpc-scale jet is generally well described by a non-thermal synchrotron power law (Smith et al. 1983; Perlman et al. 2007). In this work, we present the first JWST+NIRCam infrared images of the kpc scale jet of M87. We adopted a distance estimate of DM87 = 16.3 Mpc from Anand et al. (2025), derived from the same JWST data set and consistent with Bird et al. (2010) and EHTC et al. (2019), such that 1 arcsec ≈ 80 pc in projected distance.
2. Observations and data reduction
M87 was observed with JWST+NIRCam in June 2024 as part of a programme comprising 13 other elliptical galaxies, to calibrate surface brightness fluctuations (SBF) using tip of the red giant branch (TRGB) stars1. The NIRCam footprint on the galaxy and the detector bandwidths are shown in Fig. 1. The 64 arcsec × 64 arcsec A1 detector (0.031 arcsec/px) was exposed for 4 × 1460.2 s and 4 × 311.4 s using the F090W and F150W filters, respectively. The same respective exposure times were used for F277W and F356W on the A5 detector (129 arcsec × 129 arcsec, 0.063 arcsec/px).
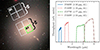 |
Fig. 1. Left: NIRCam footprint on M87 (Anand et al. 2025). The green sub-square represents the A1 detector footprint for the F090W and F150W images in this study; F277W and F356W images are taken with the lower-right half of the NIRCam footprint (detector A5). The background image was created using the online SDSS mosaic tool. Right: Detector throughputs and wavelength ranges for the four NIRCam filters used. Characteristic wavelengths are indicated in the legend. |
The raw NIRCam images were processed using the standard JWST pipeline (Bushouse 2020) to the 2b _i2d.fits level, including instrumental corrections such as flat fielding, flux (ramp) photometric calibration, bad and saturated pixel correction, and image distortion correction using bilinear (flux-conserving) interpolation. The images for each wavelength were created by stacking four dithered exposures, each offset by a few pixels to allow for correction of bad pixels and cosmic rays; however, the offsets were not large enough to correct for the large patch of bad pixels in the A1 detector located inconveniently near the end of the jet.
The exposure times were chosen to achieve the depth needed to detect the red giant branch (RGB) stars in the outer fields and to minimise the data volume; as a consequence, the pixels covering the galaxy centre were saturated. The combined images were scaled2 to units of Jy/arcsec2; the uncertainties in the photometric zero points are currently estimated to be 1%–2% in individual detectors at the shorter wavelengths and 2%–4% in the longer wavelength filters3.
To isolate the jet, the dominant galactic emission had to be removed (see Appendix A). We first subtracted a constant background level for each filter, measured by the most distant detectors from the galaxy centre (B1 and B5, respectively, which correspond to the upper-left corner and upper left half of the footprint in Fig. 1). Then, we masked extraneous objects, such as foreground stars, dust in the galaxy, background galaxies, globular clusters, and the jet, prior to modelling the galaxy at each wavelength using the elliprof program (Tonry et al. 1997; Jordán et al. 2004). This technique fits the galaxy surface brightness in concentric elliptical annuli moving out from the centre, past the end of the jet, and extrapolates the model to the edges of the frame. Lastly, we fitted a smooth residual background function on a 15 × 15 pixel grid to ensure that the global background level was exactly zero and that any smooth residual patterns from the galaxy subtraction process were removed.
3. Results
3.1. Jet structure
Figure 2 shows the galaxy-subtracted and masked residual jet images for the four wavelength bands. There are saturated pixels in the nucleus and in the case of 2.77 μm, they are present in some bright jet knots. Therefore, it was not possible to extract information from these regions. Before masking, the image background appears very bumpy (see Appendix A); this is not detector or background noise, but, rather, fluctuations in surface brightness caused by the Poisson statistics of the discrete number of red giant stars per pixel. On small scales of a few pixels, the surface brightness fluctuations contribute to flux randomly and only average out on scales significantly larger than the point spread function (PSF).
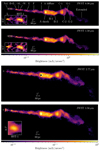 |
Fig. 2. Masked residual jet images with dynamic range of 200 and limits chosen to maximise the visibility of individual features. The first component in the longer-wavelength images (185 × 502 pixels) is HST-1. The shorter-wavelength images (255 × 1020 pixels) contain the most upstream component, L. |
We identified the individual jet components, adopting the naming convention from Biretta et al. (1999) and Perlman et al. (2001). The centroid of the innermost distinct component, which we associate with the slowly moving knot, L, of Biretta et al. (1999), is located at (320 ± 50) mas downstream from the core. We estimated the component size of 60 mas × 150 mas (FWHM of a fitted elliptical Gaussian), elongated in the direction of the jet, with a flux density of (25 ± 10) μJy measured at 1.50 μm.
At the estimated distance of (950 ± 50) mas from the nucleus sits HST-1, the fastest moving superluminal feature on these scales (up to 24.1 mas/yr; see also Chang et al. 2010; Thimmappa et al. 2024). HST-1 is transversely resolved, with a fitted size of 80 mas × 230 mas, and is tilted about 10° away from the jet axis. A substructure of two similarly sized components is well resolved, with a (150 ± 20) mas separation between the brightness centroids and the downstream component shifted off the jet axis. The total measured flux density of HST-1 is (110 ± 20) μJy and the inner component is brighter by around 30%, compared to the outer one at 1.50 μm. The subcomponents blend together at longer wavelengths, as seen in the last panel of Fig. 2.
HST-1 is followed by component D, split into its eastern, middle, and western parts. D-east is the brightest, and is connected to D-west by a ’twist’ denoted as D-middle. The individual parts of D, as well as the more diffuse component E, move at mildly superluminal speeds (Biretta et al. 1995, 1999). Component F has a clear double structure in the two shorter wavelength images, and component I appears distinct, but both are blended into the jet emission at the longer wavelengths. The compound of components A and B features the bright shock (Perlman et al. 2001), followed by more diffuse emission, as well as a subsequent bend composed of components C and G. The jet fades out into extended emission, more apparent in F277W and F356W.
Apart from the prominent forward jet, we detected signatures of a decelerating counter-jet around 24 arcsec from the nucleus (Sparks et al. 1992; Stiavelli et al. 1992). In the 2.77 and 3.56 μm images, the counter-jet consists of two filaments connected by a hotspot, forming a C-shape, consistent with its morphology in the radio wavelengths (Pasetto et al. 2021). In the 0.90 and 1.50 μm images, only a faint trace of the hotspot can be detected and the filaments are not visible (see Appendix B for details).
3.2. Near-infrared spectral index
Figure 3 shows the optical and infrared spectrum of M87, centred around the 0.1–10 μm infrared bump caused by the H− opacity minimum in cool stars (Sorba & Sawicki 2010), peaking at ∼1.6 μm. Our shorter wavelength observations fall before the peak of the bump; the flux density then falls sharply between 1.50 μm and 2.77 μm across the peak, following the spectrum of the cool, old, low-mass stars in the giant elliptical galaxy (Bruzual A. & Charlot 1993).
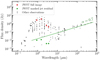 |
Fig. 3. Optical and infrared spectrum of M87 with the total and residual image fluxes obtained from the JWST observations overplotted. The spectrum was created with SSDC building tools using data from the NASA/IPAC Extragalactic Database. |
Integrated flux densities of images, galaxy models, constant background levels, and residuals are reported in Table 1. Taken individually, the total fluxes of the masked jet in the residual images are broadly consistent with the radio-to-optical spectrum with a spectral index α = 0.7 − 1.0; however, taken altogether, they clearly follow a similar trend as the galaxy stellar bump (see Fig. 3). Given that some pixels are saturated, the reported jet fluxes constitute lower bounds on the total emission.
Image-integrated flux densities.
To obtain the resolved spectral index maps, the 0.9–1.5 μm and 2.77–3.56 μm image pairs were first aligned in Fourier space to correct for residual translation offsets between filters. Between 0.90 μm and 1.50 μm, the jet is generally optically thin (α > 0; see top panel in Fig. 4); in most of the individual components leading up to the shock (component A), the spectral index is almost flat. Beyond A and B, the spectrum appears to steepen mildly, likely due to synchrotron cooling (e.g. Snios et al. 2019).
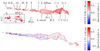 |
Fig. 4. Spectral index maps of the isolated M87 infrared jet between the short and long wavelength images, respectively (top and bottom panels). The index α is defined as Sλ ∝ λα (∝ ν−α). Floors of 0.5% (top panel) and 1.5% (bottom panel) of the image maxima were applied prior to calculating the spectral index. The images have the same spatial scale. |
Component L is characterised by a strong spectral index gradient, with α growing in the downstream direction. HST-1 shows a mean α = 0.05, but the two sub-components are clearly distinct: the upstream one is characterised by αup = −0.15 and the downstream one by αdo = 0.30. This further supports the multi-component structure of HST-1, as indicated in Fig. 2. Indeed, this structure was previously studied by Biretta et al. (1999), while HST-1 was recently modelled with two components in Chandra X-ray observations as well (Thimmappa et al. 2024). Both the overall flattening and gradient of the spectral index within the knots support the assumption of a recollimation shock with respect to the nature of these features (Laing & Bridle 2013).
At longer wavelengths, the spectral index is mostly flat along the jet, if not mildly negative. For parts of L, HST-1, D-East, and A, no spectral index can be obtained since the pixels are saturated in the 2.77 μm image. Similarly to the short wavelengths, the spectrum steepens in the extended emission region, downstream from the C component. As an alternative way to visualise the spectral structure of M87 we provide the multi-filter image mapped onto red, green, and blue (RGB) space in Appendix C.
4. Discussion and conclusion
Since the synchrotron loss dominated jet sustains a power law spectrum across many orders of magnitude in wavelength and spatial scale, the radiative losses must be somewhat balanced by the internal particle acceleration mechanism. Lesch & Birk (1998) proposed continuous magnetic reconnection-driven particle acceleration to achieve the necessary energies for optical emission. Their conclusion was that for this process to be dominant, the jets must contain magnetic flux filaments across the appropriate scales.
Indeed, jets are often characterised by a large-scale helical filamentary substructure (e.g. Fuentes et al. 2023) and this is also the case for M87 on the scales probed by the observations presented in this work. The helical jet structure is not necessarily indicative of a similarly structured magnetic field, even though both are present in the M87 jet and coincide well (Pasetto et al. 2021). The magnetic field structure may be deduced from the polarised emission, which cannot be recovered from NIRCam observations. However, components D, E, F, and I of our JWST images follow the known double helix in M87, shaped by Kelvin-Helmholtz instabilities (e.g. Lobanov et al. 2003; Hardee & Eilek 2011; Nikonov et al. 2023), specifically their elliptical surface mode, consistent with Pasetto et al. (2021).
Ultimately, jets decelerate through interactions with the interstellar medium and the conversion of bulk kinetic into internal energy, accelerating particles and dissipating energy as radiation (e.g. Laing & Bridle 2014). In our M87 images, this occurs at the projected distance of ∼2 kpc from the nucleus. Fichet de Clairfontaine et al. (2025) showed that the distribution of gas in the galaxy may influence the extent of the radio emission region, whereas the stellar population can interact with the jet via stellar wind driven mass loading, influencing the dissipation region.
In this work, we present the first JWST+NIRCam images of the M87 jet at 0.90, 1.50, 2.77, and 3.56 μm. Our observations fall into the 1.6 μm infrared bump, dominated by stellar emission; while this bias could not be entirely removed during the galaxy subtraction process, the residual jet images are broadly consistent with the radio to optical spectrum. In the higher resolution, shorter wavelength images, we identified all distinct jet components up to ∼24 arcsec from the nucleus, including HST-1, the more upstream knot L, and the bright shock farther downstream. The images and spectral index maps provided further evidence for a complex substructure of HST-1, as indicated by previous works. In the 2.77 and 3.56 μm images we also detect the counter-jet ∼24 arcsec from the nucleus and found its morphology to be consistent with radio observations.
Acknowledgments
We thank the TRGB-SBF Project team, as well as J. L. Gómez, T. Savolainen and S. Markoff for comments on the manuscript. JR further acknowledges financial support from the Severo Ochoa grant CEX2021-001131-S funded by MCIN/AEI/10.13039/501100011033. MW is supported by a Ramón y Cajal grant RYC2023-042988-I from the Spanish Ministry of Science and Innovation. JJ and GSA acknowledge financial support from STScI grant JWST GO-3055. This work used observations made with the NASA/ESA/CSA James Webb Space Telescope. The data were obtained from the Mikulski Archive for Space Telescopes at the Space Telescope Science Institute, which is operated by the Association of Universities for Research in Astronomy, Inc., under NASA contract NAS 5-03127 for JWST. These observations are associated with JWST programme GO-3055. This research has made use of the NASA/IPAC Extragalactic Database, which is funded by the National Aeronautics and Space Administration and operated by the California Institute of Technology (https://doi.org/10.26132/NED1). This research has made use of the VizieR catalogue access tool, CDS, Strasbourg, France (Ochsenbein 1996). The original description of the VizieR service was published in Ochsenbein et al. (2000).
References
- Anand, G. S., Tully, R. B., Cohen, Y., et al. 2025, ApJ, 982, 26 [Google Scholar]
- Baade, W. 1956, ApJ, 123, 550 [Google Scholar]
- Baldwin, J. E., & Smith, F. G. 1956, Observatory, 76, 141 [Google Scholar]
- Bird, S., Harris, W. E., Blakeslee, J. P., & Flynn, C. 2010, A&A, 524, A71 [NASA ADS] [CrossRef] [EDP Sciences] [Google Scholar]
- Biretta, J. A., Zhou, F., & Owen, F. N. 1995, ApJ, 447, 582 [NASA ADS] [CrossRef] [Google Scholar]
- Biretta, J. A., Sparks, W. B., & Macchetto, F. 1999, ApJ, 520, 621 [NASA ADS] [CrossRef] [Google Scholar]
- Boksenberg, A., Macchetto, F., Albrecht, R., et al. 1992, A&A, 261, 393 [NASA ADS] [Google Scholar]
- Britzen, S., Fendt, C., Eckart, A., & Karas, V. 2017, A&A, 601, A52 [NASA ADS] [CrossRef] [EDP Sciences] [Google Scholar]
- Bruzual A., G., & Charlot, S. 1993, ApJ, 405, 538 [NASA ADS] [CrossRef] [Google Scholar]
- Bushouse, H. 2020, in Astronomical Data Analysis Software and Systems XXIX, eds. R. Pizzo, E. R. Deul, J. D. Mol, J. de Plaa, & H. Verkouter, ASP Conf. Ser., 527, 583 [NASA ADS] [Google Scholar]
- Chang, C. S., Ros, E., Kovalev, Y. Y., & Lister, M. L. 2010, A&A, 515, A38 [NASA ADS] [CrossRef] [EDP Sciences] [Google Scholar]
- Cui, Y., Hada, K., Kawashima, T., et al. 2023, Nature, 621, 711 [NASA ADS] [CrossRef] [Google Scholar]
- Curtis, H. D. 1918, Publ. Lick Obs., 13, 9 [NASA ADS] [Google Scholar]
- EHT MWL WG, Algaba, J. C., Anczarski, J., et al. 2021, ApJ, 911, L11 [NASA ADS] [CrossRef] [Google Scholar]
- EHT MWL WG, Algaba, J. C., Baloković, M., et al. 2024, A&A, 692, A140 [NASA ADS] [CrossRef] [EDP Sciences] [Google Scholar]
- EHTC, Akiyama, K., Alberdi, A., et al. 2019, ApJ, 875, L1 [NASA ADS] [CrossRef] [Google Scholar]
- EHTC, Akiyama, K., Alberdi, A., et al. 2024, A&A, 681, A79 [NASA ADS] [CrossRef] [EDP Sciences] [Google Scholar]
- Fichet de Clairfontaine, G., Perucho, M., Martí, J. M., & Kovalev, Y. Y. 2025, A&A, 693, A270 [NASA ADS] [CrossRef] [EDP Sciences] [Google Scholar]
- Fuentes, A., Gómez, J. L., Martí, J. M., et al. 2023, Nat. Astron., 7, 1359 [NASA ADS] [CrossRef] [Google Scholar]
- H.E.S.S. Collaboration (Aharonian, F., et al.) 2024, A&A, 685, A96 [NASA ADS] [CrossRef] [EDP Sciences] [Google Scholar]
- Hada, K., Asada, K., Nakamura, M., & Kino, M. 2024, A&ARv, 32, 5 [NASA ADS] [Google Scholar]
- Hardee, P. E., & Eilek, J. A. 2011, ApJ, 735, 61 [NASA ADS] [CrossRef] [Google Scholar]
- Harris, D. E., Cheung, C. C., Stawarz, Ł., Biretta, J. A., & Perlman, E. S. 2009, ApJ, 699, 305 [NASA ADS] [CrossRef] [Google Scholar]
- Jordán, A., Blakeslee, J. P., Peng, E. W., et al. 2004, ApJS, 154, 509 [CrossRef] [Google Scholar]
- Kim, J. Y., Krichbaum, T. P., Lu, R. S., et al. 2018, A&A, 616, A188 [NASA ADS] [CrossRef] [EDP Sciences] [Google Scholar]
- Kim, J.-S., Müller, H., Nikonov, A. S., et al. 2025, A&A, 696, A169 [NASA ADS] [CrossRef] [EDP Sciences] [Google Scholar]
- Kovalev, Y. Y., Lister, M. L., Homan, D. C., & Kellermann, K. I. 2007, ApJ, 668, L27 [NASA ADS] [CrossRef] [Google Scholar]
- Laing, R. A., & Bridle, A. H. 2013, MNRAS, 432, 1114 [NASA ADS] [CrossRef] [Google Scholar]
- Laing, R. A., & Bridle, A. H. 2014, MNRAS, 437, 3405 [NASA ADS] [CrossRef] [Google Scholar]
- Lesch, H., & Birk, G. T. 1998, ApJ, 499, 167 [NASA ADS] [CrossRef] [Google Scholar]
- Lessing, A. M., Shara, M. M., Hounsell, R., et al. 2024, ApJ, 973, 144 [Google Scholar]
- Lobanov, A., Hardee, P., & Eilek, J. 2003, New Astron. Rev., 47, 629 [CrossRef] [Google Scholar]
- Lu, R.-S., Asada, K., Krichbaum, T. P., et al. 2023, Nature, 616, 686 [CrossRef] [Google Scholar]
- Madrid, J. P., Sparks, W. B., Harris, D. E., et al. 2007, Ap&SS, 311, 329 [Google Scholar]
- Marshall, H. L., Miller, B. P., Davis, D. S., et al. 2002, ApJ, 564, 683 [Google Scholar]
- Mertens, F., Lobanov, A. P., Walker, R. C., & Hardee, P. E. 2016, A&A, 595, A54 [NASA ADS] [CrossRef] [EDP Sciences] [Google Scholar]
- Messier, C. 1781, Catalogue des Nébuleuses et des Amas d’Étoiles (Catalog of Nebulae and Star Clusters), Connoissance des Temps ou des Mouvements Célestes, for 1784, 227 [Google Scholar]
- Meyer, E. T., Sparks, W. B., Biretta, J. A., et al. 2013, ApJ, 774, L21 [NASA ADS] [CrossRef] [Google Scholar]
- Nikonov, A. S., Kovalev, Y. Y., Kravchenko, E. V., Pashchenko, I. N., & Lobanov, A. P. 2023, MNRAS, 526, 5949 [NASA ADS] [CrossRef] [Google Scholar]
- Ochsenbein, F. 1996, Bull. Inf. CDS, 48, 47 [Google Scholar]
- Ochsenbein, F., Bauer, P., & Marcout, J. 2000, A&AS, 143, 23 [NASA ADS] [CrossRef] [EDP Sciences] [Google Scholar]
- Pasetto, A., Carrasco-González, C., Gómez, J. L., et al. 2021, ApJ, 923, L5 [NASA ADS] [CrossRef] [Google Scholar]
- Perlman, E. S., Biretta, J. A., Zhou, F., Sparks, W. B., & Macchetto, F. D. 1999, AJ, 117, 2185 [NASA ADS] [CrossRef] [Google Scholar]
- Perlman, E. S., Biretta, J. A., Sparks, W. B., Macchetto, F. D., & Leahy, J. P. 2001, ApJ, 551, 206 [Google Scholar]
- Perlman, E. S., Harris, D. E., Biretta, J. A., Sparks, W. B., & Macchetto, F. D. 2003, ApJ, 599, L65 [Google Scholar]
- Perlman, E. S., Mason, R. E., Packham, C., et al. 2007, ApJ, 663, 808 [Google Scholar]
- Prieto, M. A., Fernández-Ontiveros, J. A., Markoff, S., Espada, D., & González-Martín, O. 2016, MNRAS, 457, 3801 [NASA ADS] [CrossRef] [Google Scholar]
- Punsly, B. 2023, A&A, 677, A180 [NASA ADS] [CrossRef] [EDP Sciences] [Google Scholar]
- Reid, M. J., Biretta, J. A., Junor, W., Muxlow, T. W. B., & Spencer, R. E. 1989, ApJ, 336, 112 [NASA ADS] [CrossRef] [Google Scholar]
- Schreier, E. J., Gorenstein, P., & Feigelson, E. D. 1982, ApJ, 261, 42 [Google Scholar]
- Smith, R. M., Bicknell, G. V., Hyland, A. R., & Jones, T. J. 1983, ApJ, 266, 69 [Google Scholar]
- Snios, B., Nulsen, P. E. J., Kraft, R. P., et al. 2019, ApJ, 879, 8 [NASA ADS] [CrossRef] [Google Scholar]
- Sorba, R., & Sawicki, M. 2010, ApJ, 721, 1056 [Google Scholar]
- Sparks, W. B., Fraix-Burnet, D., Macchetto, F., & Owen, F. N. 1992, Nature, 355, 804 [CrossRef] [Google Scholar]
- Stiavelli, M., Biretta, J., Møller, P., & Zeilinger, W. W. 1992, Nature, 355, 802 [NASA ADS] [CrossRef] [Google Scholar]
- Thimmappa, R., Neilsen, J., Haggard, D., Nowak, M., & Markoff, S. 2024, ApJ, 969, 128 [Google Scholar]
- Tonry, J. L., Blakeslee, J. P., Ajhar, E. A., & Dressler, A. 1997, ApJ, 475, 399 [Google Scholar]
Appendix A: Model subtraction and masking
As detailed in Section 2, each image is processed by subtracting a constant background level measured far from the galaxy centre, along with the smooth galaxy model fitted in elliptical annuli. We additionally fitted a smooth model to the residual image after the galaxy model was subtracted to remove any residual galaxy structure and to ensure that the background level was exactly zero. Lastly, a mask is applied to spatially isolate the jet region from the residual emission caused by stellar surface brightness fluctuations.
The calibration procedure, requiring very accurate characterisation of the JWST-NIRCam instrument and including modelling of the galactic component, may be subject to residual systematics that are difficult to identify. In particular, the inverted spectrum implied by the F277W and F356W measurements is a puzzling result that is difficult to reconcile with optically thin synchrotron emission, and would require a contribution from Compton scattering. Future improvements to the calibration of the instrument will clarify these issues.
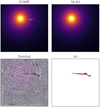 |
Fig. A.1. Processing of the F150W image: Full F150W image, smooth galaxy model, residual, and masked jet image. The prominent patch in the jet bend, appearing black in the full image and white in the residual, is a clump of bad pixels in the A1 detector. The two upper images are on a linear, the other two on a logarithmic colour scale; white pixels in the residual image indicate negative residual flux values following the subtraction of the mean component of the galaxy model. |
Appendix B: Counter-jet
We detected faint emission from the C-shaped counter-jet in all wavelength bands, most prominently in the longer wavelength images, see Fig. B.1. The counter-jet consists of two filaments connected by a hot spot, which is the only (barely) visible part in the shorter wavelengths. Figure B.2 indicates the image regions used for the presented analysis, as well as the relative position of the jet and counter-jet components. The hot spot component of the counter-jet appears 24 arcsec away from the nucleus, transitioning into a corkscrew shape below (right panels in Fig. B.1). This morphology is consistent with VLA observations (Pasetto et al. 2021).
Along the forward jet, the faint extended emission further downstream from the jet knots (labelled in Fig. 2) is located at the same 24 arcsec distance from the nucleus, likely corresponding to deflected jet material, decelerating through interactions with the interstellar medium. The upstream part of the counter-jet is not visible, presumably due to strong Doppler de-boosting. We measured the total flux density of the observed counter-jet component to be (230 ± 30) μJy at 3.56 μm, and (220 ± 30) μJy at 2.77 μm.
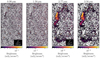 |
Fig. B.1. Counter-jet in the JWST images of M87. The images are shown in logarithmic colour scale, with limits chosen for best visibility of the counter-jet; the dynamic ranges are 5 for the short, and 6.25 for the long wavelengths. The negative pixels were coloured white instead of black to further increase the contrast. |
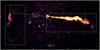 |
Fig. B.2. Regions in the 3.56 μm residual image used to analyse the jet (Fig. 2) and counter-jet (Fig. B.1). The hot spot component of the counter-jet appears about 24 arcsec away from the nucleus. |
Appendix C: RGB image of M87
To simultaneously visualise observations recorded with multiple filters, we obtained an RGB image of M87 using the F356W, F150W and F090W data mapped onto the red, green and blue channels. Bad pixels were filled with the mean flux of good pixels in each colour layer. The image is aligned with the celestial equatorial coordinate system (north is up).
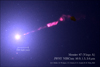 |
Fig. C.1. RGB image of M87 obtained using F356W, F150W, and F090W observations. |
All Tables
All Figures
|
Fig. 1. Left: NIRCam footprint on M87 (Anand et al. 2025). The green sub-square represents the A1 detector footprint for the F090W and F150W images in this study; F277W and F356W images are taken with the lower-right half of the NIRCam footprint (detector A5). The background image was created using the online SDSS mosaic tool. Right: Detector throughputs and wavelength ranges for the four NIRCam filters used. Characteristic wavelengths are indicated in the legend. |
| In the text | |
|
Fig. 2. Masked residual jet images with dynamic range of 200 and limits chosen to maximise the visibility of individual features. The first component in the longer-wavelength images (185 × 502 pixels) is HST-1. The shorter-wavelength images (255 × 1020 pixels) contain the most upstream component, L. |
| In the text | |
|
Fig. 3. Optical and infrared spectrum of M87 with the total and residual image fluxes obtained from the JWST observations overplotted. The spectrum was created with SSDC building tools using data from the NASA/IPAC Extragalactic Database. |
| In the text | |
|
Fig. 4. Spectral index maps of the isolated M87 infrared jet between the short and long wavelength images, respectively (top and bottom panels). The index α is defined as Sλ ∝ λα (∝ ν−α). Floors of 0.5% (top panel) and 1.5% (bottom panel) of the image maxima were applied prior to calculating the spectral index. The images have the same spatial scale. |
| In the text | |
|
Fig. A.1. Processing of the F150W image: Full F150W image, smooth galaxy model, residual, and masked jet image. The prominent patch in the jet bend, appearing black in the full image and white in the residual, is a clump of bad pixels in the A1 detector. The two upper images are on a linear, the other two on a logarithmic colour scale; white pixels in the residual image indicate negative residual flux values following the subtraction of the mean component of the galaxy model. |
| In the text | |
|
Fig. B.1. Counter-jet in the JWST images of M87. The images are shown in logarithmic colour scale, with limits chosen for best visibility of the counter-jet; the dynamic ranges are 5 for the short, and 6.25 for the long wavelengths. The negative pixels were coloured white instead of black to further increase the contrast. |
| In the text | |
|
Fig. B.2. Regions in the 3.56 μm residual image used to analyse the jet (Fig. 2) and counter-jet (Fig. B.1). The hot spot component of the counter-jet appears about 24 arcsec away from the nucleus. |
| In the text | |
|
Fig. C.1. RGB image of M87 obtained using F356W, F150W, and F090W observations. |
| In the text | |
Current usage metrics show cumulative count of Article Views (full-text article views including HTML views, PDF and ePub downloads, according to the available data) and Abstracts Views on Vision4Press platform.
Data correspond to usage on the plateform after 2015. The current usage metrics is available 48-96 hours after online publication and is updated daily on week days.
Initial download of the metrics may take a while.