| Issue |
A&A
Volume 701, September 2025
|
|
|---|---|---|
| Article Number | C1 | |
| Number of page(s) | 2 | |
| Section | Interstellar and circumstellar matter | |
| DOI | https://doi.org/10.1051/0004-6361/202556797e | |
| Published online | 15 September 2025 | |
An analytical model for the magnetic field in the thick shell of Galactic bubbles with uniform initial conditions (Corrigendum)
1
Université Libre de Bruxelles, Science Faculty CP230, B-1050 Brussels, Belgium
2
Institut für Astroteilchenphysik, Karlsruher Institut für Technologie, Karlsruhe 76344, Germany
3
Institutt for fysikk, Norwegian University of Science and Technology (NTNU), Trondheim, Norway
★ Corresponding author: This email address is being protected from spambots. You need JavaScript enabled to view it.
Key words: polarization / ISM: bubbles / dust, extinction / ISM: magnetic fields / ISM: supernova remnants / errata, addenda
We correct an implementation error in one of the six scenarios for the magnetic field in the thick shell of the Local Bubble presented in the original paper (Pelgrims et al. 2025). The erratum concerns the scenario named SCA. For this case, the inner shell of the Local Bubble is approximated as a sphere with a radius of 216.7 pc and centered on (xsph, ysph, zsph) = (-24.8, -32.6, -23.3) pc given in the heliocentric Cartesian coordinate system. The shell is assumed to have a thickness of 35 pc, and the explosion center of the supernova is given by  pc, also in heliocentric coordinate system.
In the numerical implementation of the SCA scenario presented in the original paper, the center of the sphere was inadvertently overwritten by the explosion center. Therefore, the sky maps of the Faraday rotation measure (RM) and synchrotron Stokes parameters Q and U, and the statistics related to the comparison with data that we presented, do not correspond to the intended scenario. What is presented in the original paper corresponds to a case where the shell of the bubble is spherical with a radius of 216.7 pc and a thickness of 35 pc, but where both the explosion center and the shell center have heliocentric Cartesian coordinates: (x, y, z) = (23, -34, -122) pc.
The correct sky maps for the intended SCA scenario, obtained with an initial magnetic field amplitude of B0 = 3 µG, are shown in Fig. 1 and should replace the maps in the second row of Fig. 4 in the original paper. The updated Fig. 6, where the model maps are quantitatively compared to the data in orthographic projections, is shown in Fig. 2. The goodness of fit given in the second column of Table 3 should read as  , and
, and  . Therefore, the SCA scenario is no longer the one that provides the lowest value for the
  . Finally, we show in Fig. 3 how the reduced χ2 of the different observables change as a function of the assumed strength of the initial magnetic field for the correct SCA scenario. This figure should replace the top-right panel in Fig. 7 of the original paper.
Acknowledgements
VP acknowledges funding from a Marie Curie Action of the European Union (grant agreement No. 101107047).
References
- Pelgrims, V., Unger, M., & Maris¸, I. C. 2025, A&A, 695, A148 [NASA ADS] [CrossRef] [EDP Sciences] [Google Scholar]
- Unger, M., & Farrar, G. R. 2024, ApJ, 970, 95 [NASA ADS] [CrossRef] [Google Scholar]
© The Authors 2025
 Open Access article, published by EDP Sciences, under the terms of the Creative Commons Attribution License (https://creativecommons.org/licenses/by/4.0), which permits unrestricted use, distribution, and reproduction in any medium, provided the original work is properly cited.
This article is published in open access under the Subscribe to Open model. This email address is being protected from spambots. You need JavaScript enabled to view it. to support open access publication.
All Figures
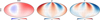 |
Fig. 1 Full-sky maps of the contributions from the shell of the Local Bubble to the RM, Q, and U signal (from left to right) as predicted for the (corrected) SCA scenario. Same convention as used in the original paper. |
| In the text | |
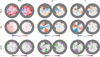 |
Fig. 2 Orthographic projection of the same data used in Unger & Farrar (2024) (top), the model predictions for the SCA scenario (middle), and pulls (bottom). The gray area is masked out. Same convention as used in the original paper. |
| In the text | |
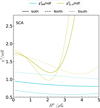 |
Fig. 3 Contribution to the reduced χ2 of the different observables as a function of B0, the strength of the initial magnetic field for the SCA scenario. The contributions from Q and U are combined. The contributions from the northern and southern hemispheres are also shown with dashed and dotted lines, respectively. |
| In the text | |
Current usage metrics show cumulative count of Article Views (full-text article views including HTML views, PDF and ePub downloads, according to the available data) and Abstracts Views on Vision4Press platform.
Data correspond to usage on the plateform after 2015. The current usage metrics is available 48-96 hours after online publication and is updated daily on week days.
Initial download of the metrics may take a while.