Fig. 1.
Download original image
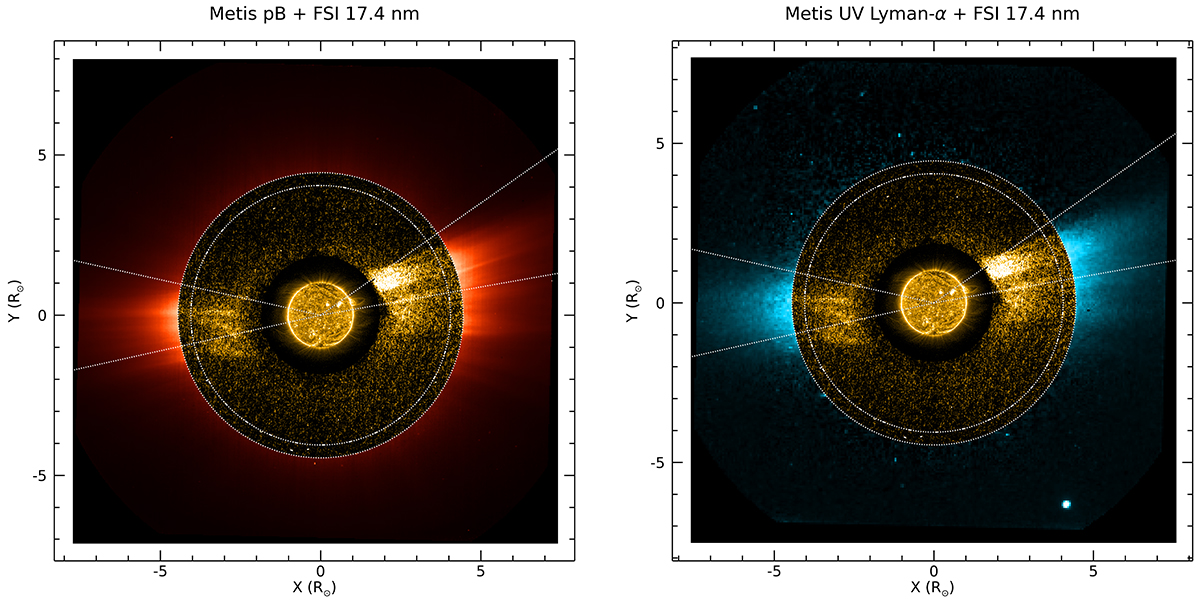
Composite of FSI 17.4 nm images obtained on March 21, 2021, on disk (at 02:46:43 UT, below 1.85 R⊙) and in coronagraphic mode (at 00:45:45 UT, between 1.85 and 4.45 R⊙), and Metis polarized-brightness (pB, left) and UV Lyman-α (right) images acquired at 03:00 UT, above 4.45 R⊙. The dotted white circles mark the inner (4.05 R⊙) and outer (4.45 R⊙) limits of the overlapping portion of FSI and the Metis fields of view. The streamer regions considered in the analysis are shown by the two angular sectors delimited by the dotted lines.
Current usage metrics show cumulative count of Article Views (full-text article views including HTML views, PDF and ePub downloads, according to the available data) and Abstracts Views on Vision4Press platform.
Data correspond to usage on the plateform after 2015. The current usage metrics is available 48-96 hours after online publication and is updated daily on week days.
Initial download of the metrics may take a while.