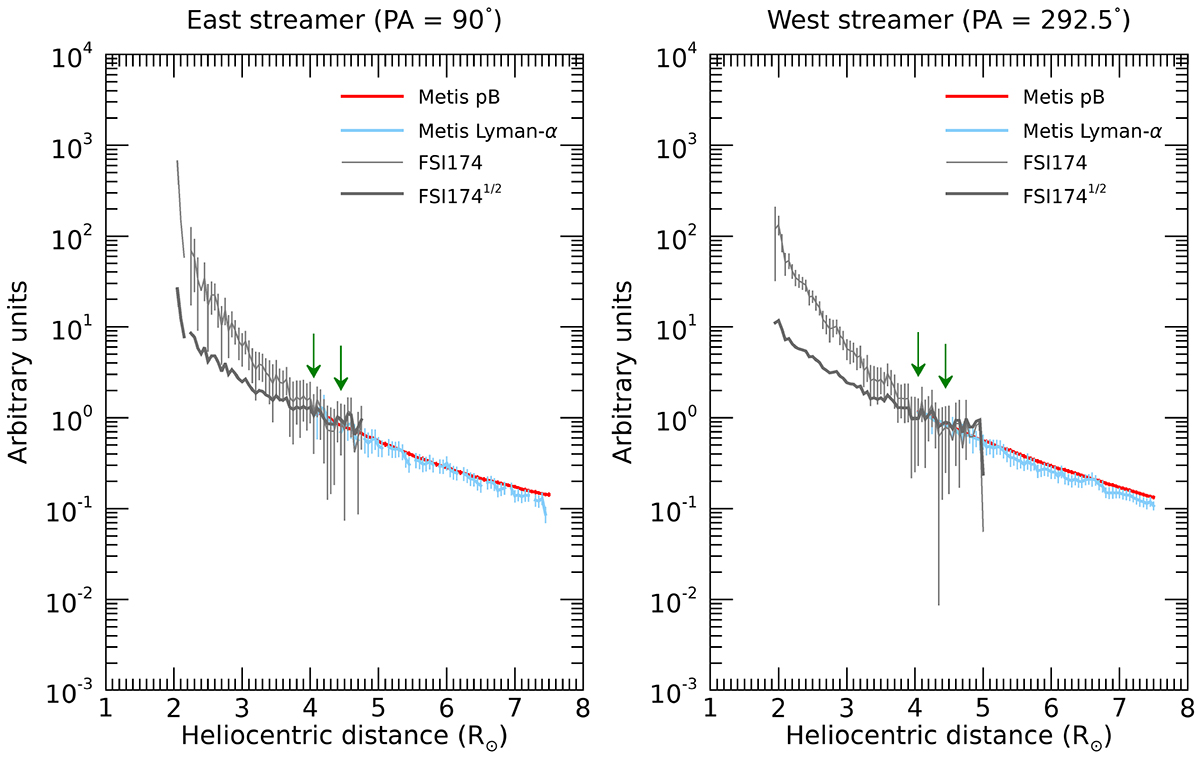
Fig. 4.
Download original image
Radial profiles of Metis pB (red lines), H I Lyman-α intensity (blue lines), FSI Fe IX/Fe X 17.4 nm intensity (thick grey lines), and the square root of FSI intensity (thick black lines) for the eastern streamer (left panel) and the western streamer (right panel). In order to be comparable, all profiles are normalized to their average value in the overlapping region between 4.05 and 4.45 R⊙, indicated in plots by the vertical green arrows.
Current usage metrics show cumulative count of Article Views (full-text article views including HTML views, PDF and ePub downloads, according to the available data) and Abstracts Views on Vision4Press platform.
Data correspond to usage on the plateform after 2015. The current usage metrics is available 48-96 hours after online publication and is updated daily on week days.
Initial download of the metrics may take a while.