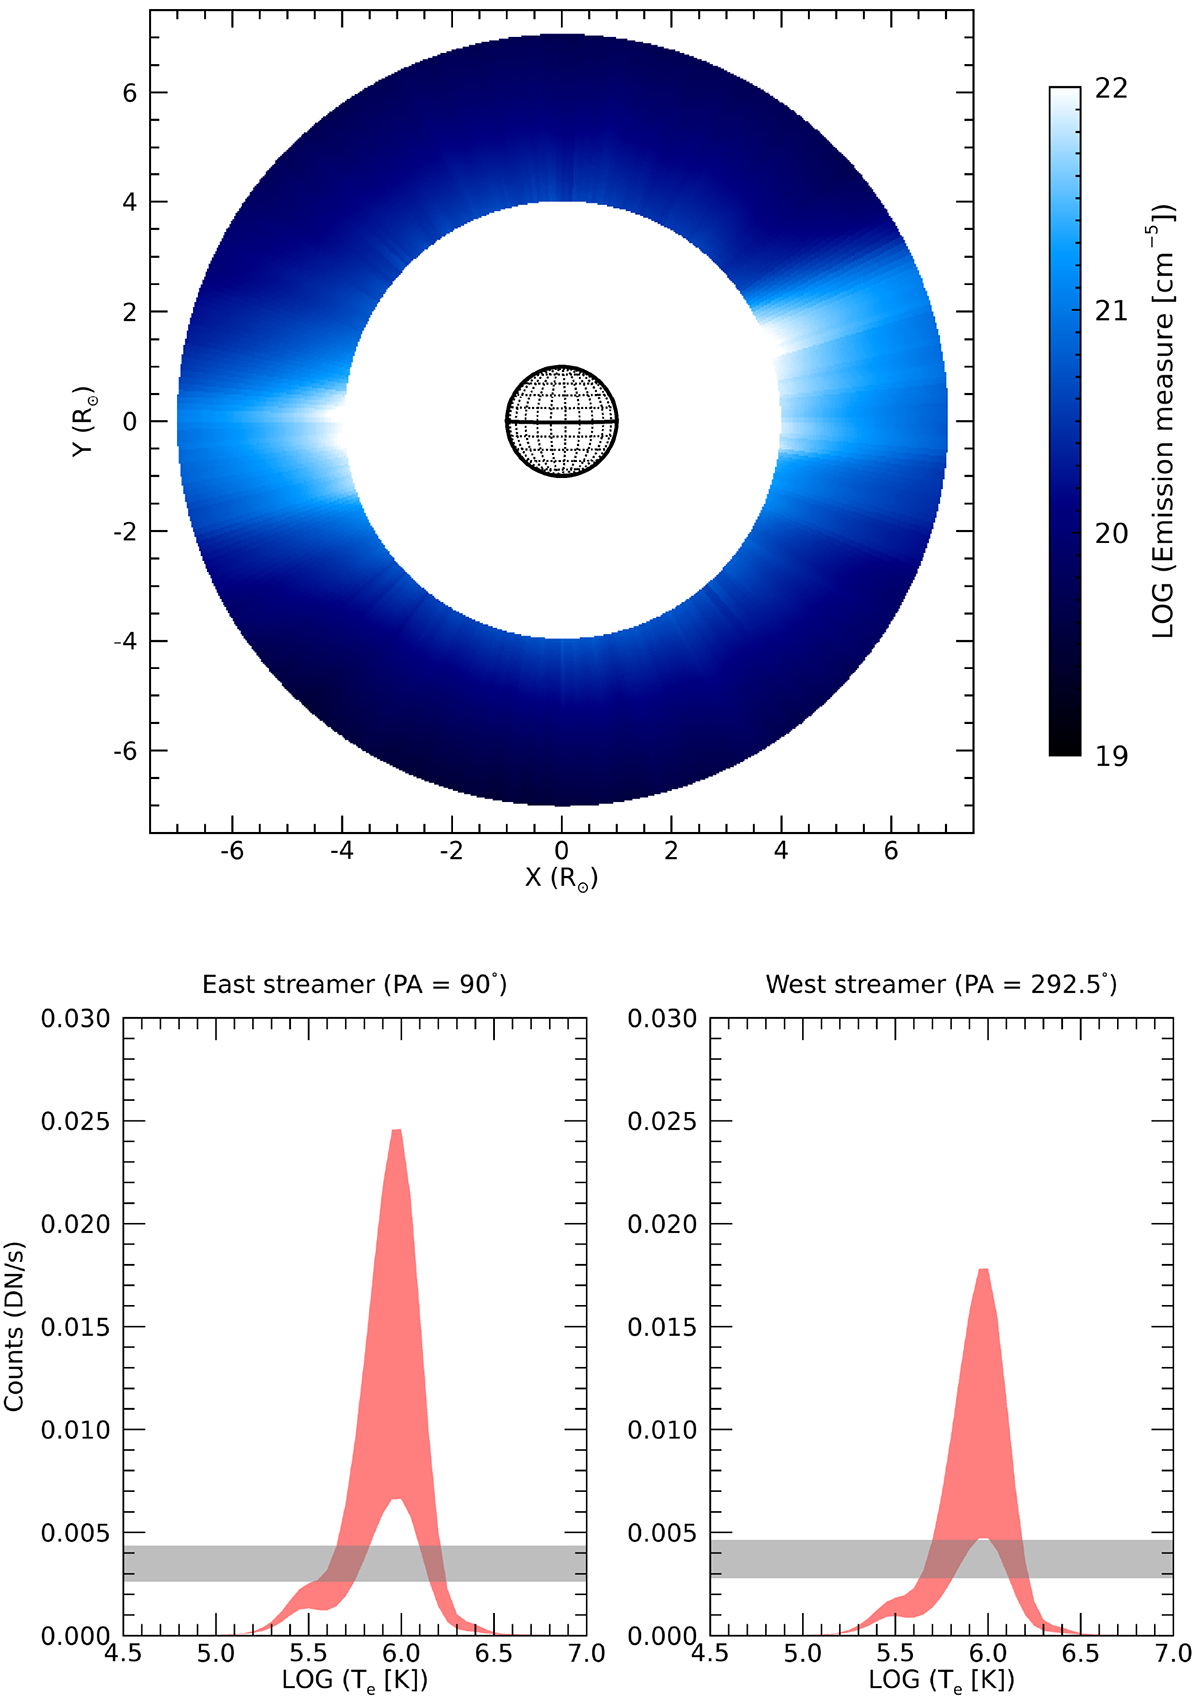
Fig. 6.
Download original image
Top: Map of EM computed from the electron density derived with Metis, as is described in the text. Bottom: Comparison between the count rates measured in the FSI 17.4 nm passband (horizontal grey bands) and the expected count rates (red bands) calculated from the EM according to Eq. (4), in the eastern (left panel) and western (right panel) streamers (the values are shown with the corresponding uncertainties, as is explained in the text).
Current usage metrics show cumulative count of Article Views (full-text article views including HTML views, PDF and ePub downloads, according to the available data) and Abstracts Views on Vision4Press platform.
Data correspond to usage on the plateform after 2015. The current usage metrics is available 48-96 hours after online publication and is updated daily on week days.
Initial download of the metrics may take a while.