Fig. 7.
Download original image
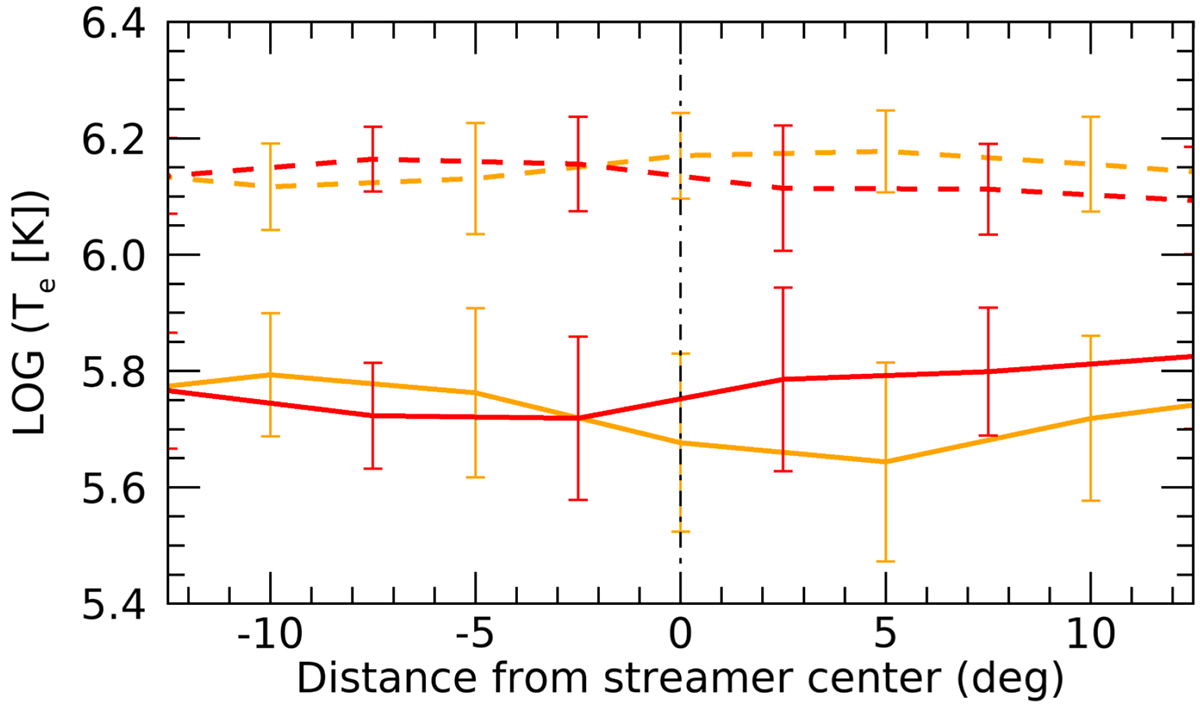
Electron temperature (in logarithmic scale) as a function of the angular distance from the center of the streamers (marked with the vertical dash-dotted line) for the eastern streamer (orange lines) and the western streamer (red lines). The lower (cold) and higher (hot) temperature solutions are identified by solid and dashed lines, respectively.
Current usage metrics show cumulative count of Article Views (full-text article views including HTML views, PDF and ePub downloads, according to the available data) and Abstracts Views on Vision4Press platform.
Data correspond to usage on the plateform after 2015. The current usage metrics is available 48-96 hours after online publication and is updated daily on week days.
Initial download of the metrics may take a while.