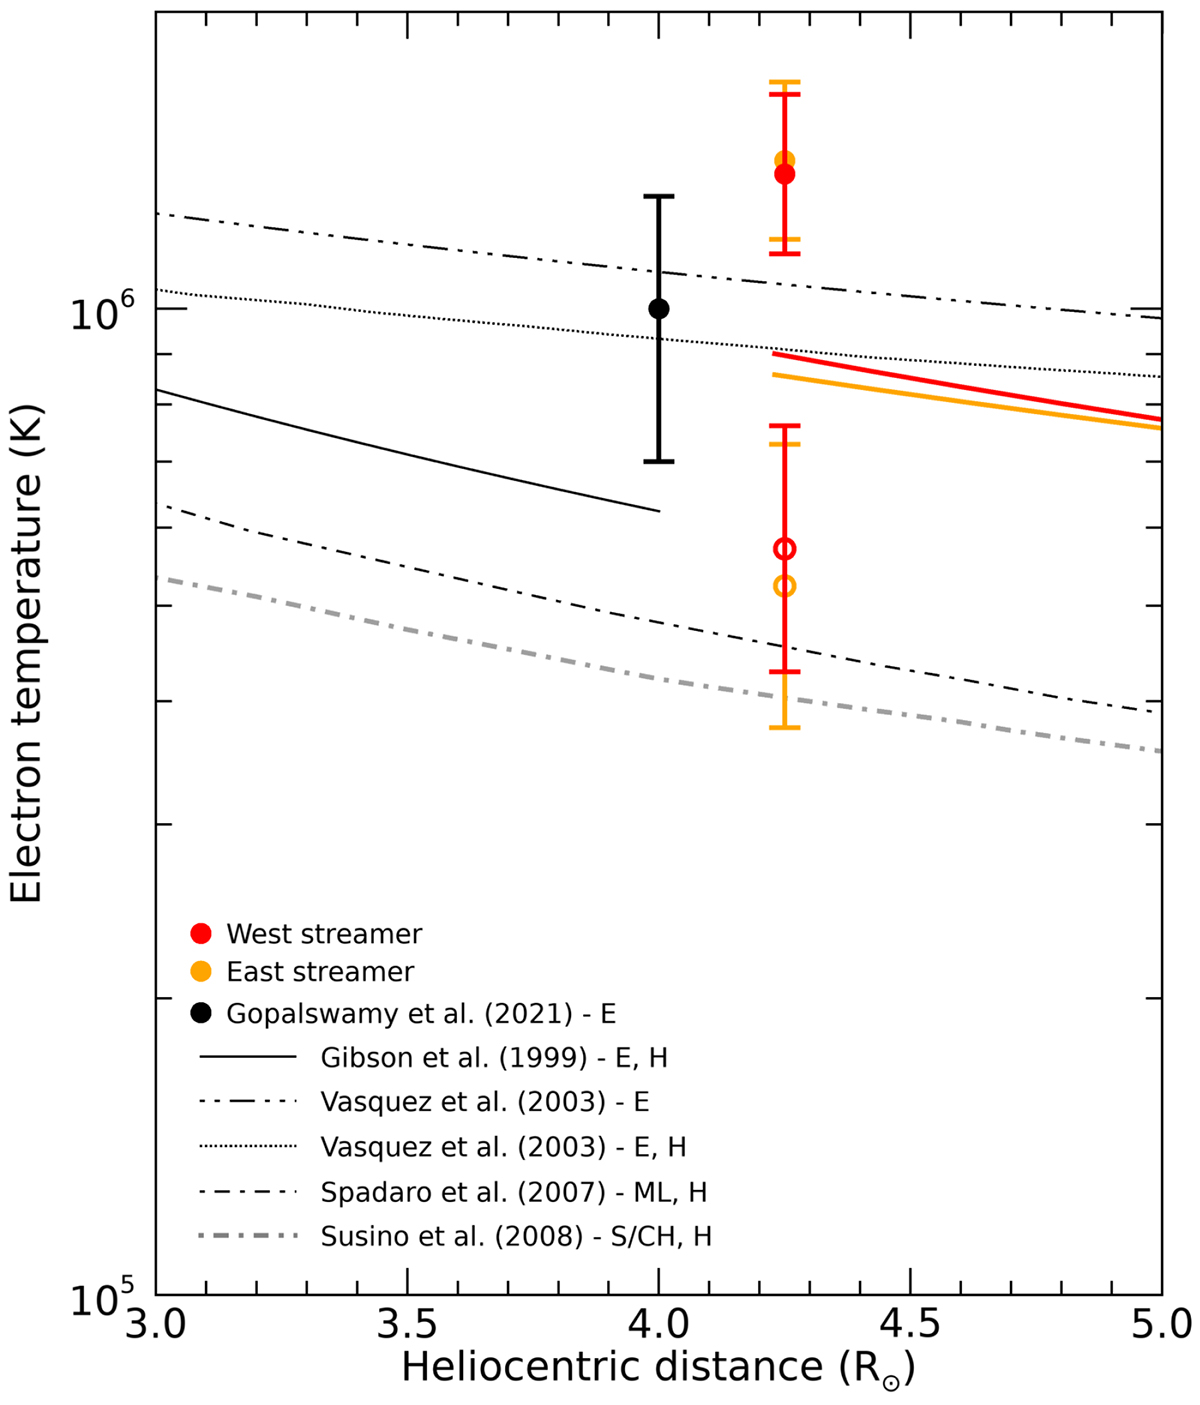
Fig. 8.

Download original image
Electron temperatures values derived for the western (red) and eastern (orange) streamers region (at the representative height of 4.25 R⊙), obtained with the method described in this work (open circles: cold solutions; filled circles: hot solutions, see the text for details). The thick coloured lines show the electron temperature profiles derived from the inversion of the ne curves obtained from Metis data assuming hydrostatic equilibrium. The inferred values are compared with others from the literature, as reported in the plot legend and in the text. In particular, we show Te profiles for equatorial (E), mid-latitude (ML) streamers, and the streamer and/or coronal-hole boundary (S/CH). Profiles with H in the legend were derived from the corresponding density profiles assuming hydrostatic equilibrium.
Current usage metrics show cumulative count of Article Views (full-text article views including HTML views, PDF and ePub downloads, according to the available data) and Abstracts Views on Vision4Press platform.
Data correspond to usage on the plateform after 2015. The current usage metrics is available 48-96 hours after online publication and is updated daily on week days.
Initial download of the metrics may take a while.


