Fig. 9.
Download original image
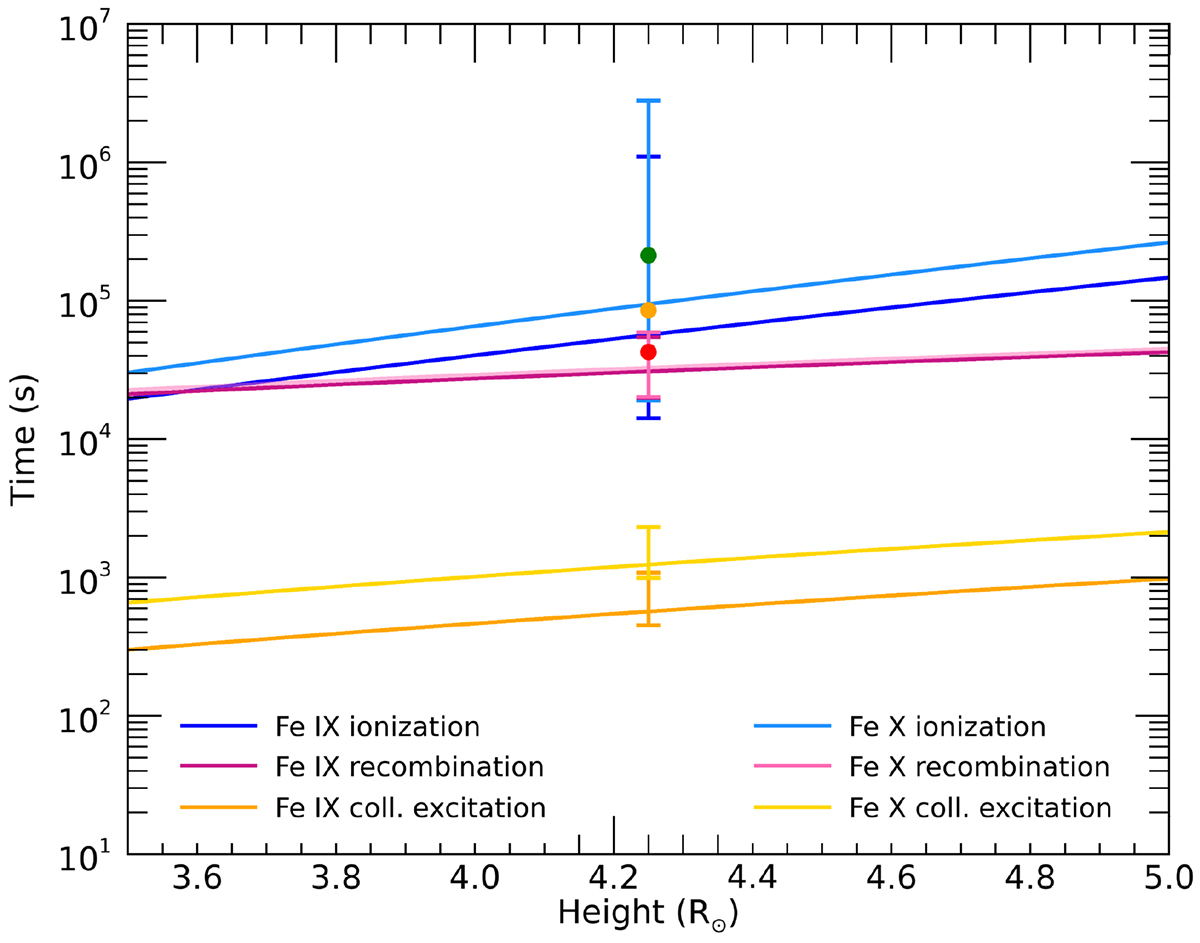
Fe IX (dark colors) and Fe X (light colors) timescales for ionization (blue lines), recombination (purple lines), and collisional excitation (yellow lines), compared with solar-wind expansion times computed at 4.25 R⊙ for three representative values of the outflow velocity (20 km s−1, green dot; 50 km s−1, orange dot; 100 km s−1, red dot). The vertical bars mark the variation in the timescales computed at 4.25 R⊙ with the two temperature values derived in the present analysis (cold solution, ∼0.5 MK, and hot solution, ∼1.4 MK). See the text for details.
Current usage metrics show cumulative count of Article Views (full-text article views including HTML views, PDF and ePub downloads, according to the available data) and Abstracts Views on Vision4Press platform.
Data correspond to usage on the plateform after 2015. The current usage metrics is available 48-96 hours after online publication and is updated daily on week days.
Initial download of the metrics may take a while.