Fig. 1.
Download original image
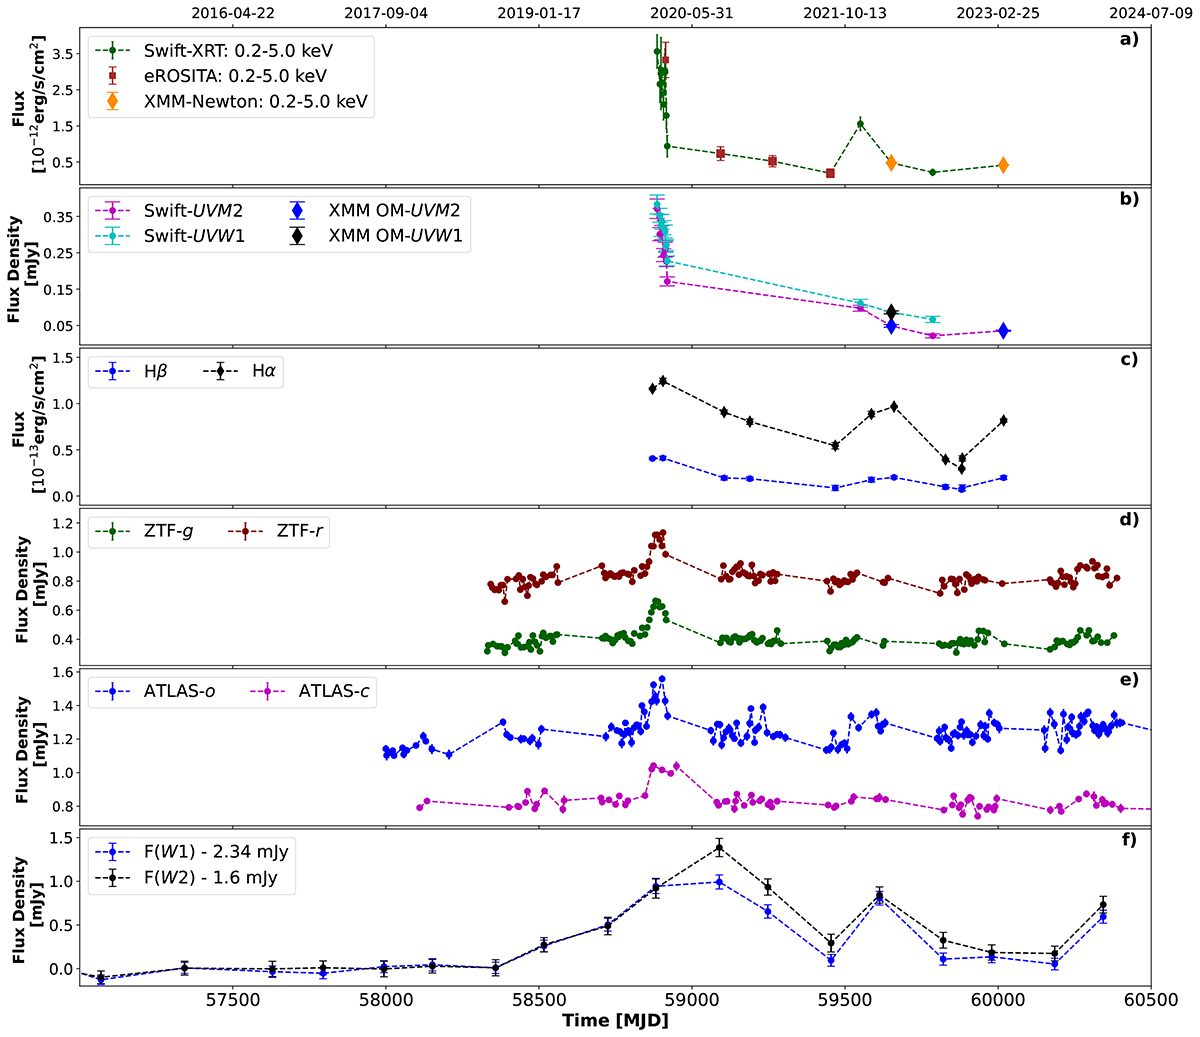
Optical, UV, and X-ray light curves for the entire period of our monitoring. From top to bottom, we show (a) 0.2–5.0 keV flux from Swift-XRT, XMM-Newton-EPIC, and eROSITA, (b) UVM2- and UVW1-band flux densities from Swift-UVOT and XMM-Newton-OM, and (c) line fluxes for the broad Hβ and Hα emission components, integrated over the whole broad profile (Sect. 4.4.1). (d) ZTF g- and r-band, (e) ATLAS c- and o-band, (f) WISE W1 and W2 bands. In panels (a), (b), (d), and (e), there are some data points for which the error bars are smaller than the marker for the data point.
Current usage metrics show cumulative count of Article Views (full-text article views including HTML views, PDF and ePub downloads, according to the available data) and Abstracts Views on Vision4Press platform.
Data correspond to usage on the plateform after 2015. The current usage metrics is available 48-96 hours after online publication and is updated daily on week days.
Initial download of the metrics may take a while.