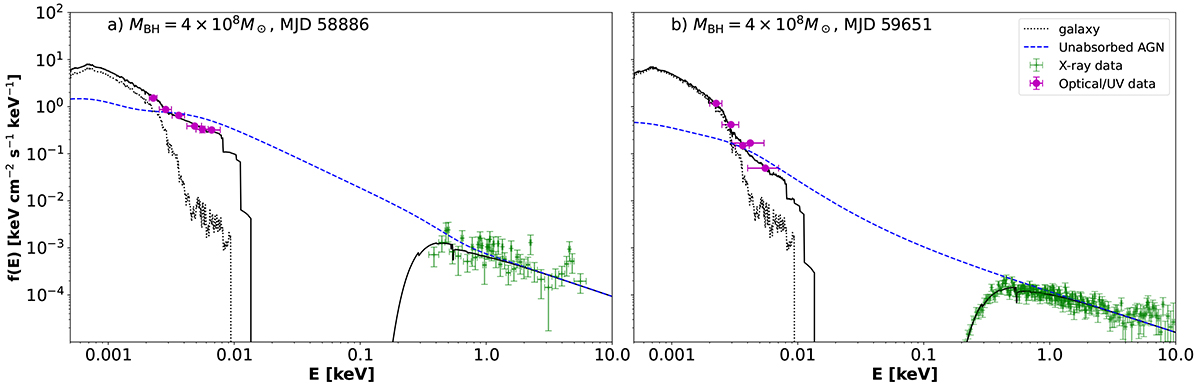
Fig. 3.
Download original image
Broadband SED fits for (a) the first Swift SED, taken near the flare peak in February 2020, and (b) the first XMM-Newton SED, taken in February 2022, assuming a black hole mass of MBH = 4 × 10⁸ M⊙. In each plot, the dashed blue line denotes the intrinsic unabsorbed AGN continuum. The dotted black line denotes the stellar contribution of the host galaxy. The solid black line denotes the Galaxy-absorbed total (AGN + host galaxy) model. The green markers represent the X-ray data and the magenta markers represent optical data. In each panel, the y-error bars are smaller for some data points than the data point marker.
Current usage metrics show cumulative count of Article Views (full-text article views including HTML views, PDF and ePub downloads, according to the available data) and Abstracts Views on Vision4Press platform.
Data correspond to usage on the plateform after 2015. The current usage metrics is available 48-96 hours after online publication and is updated daily on week days.
Initial download of the metrics may take a while.