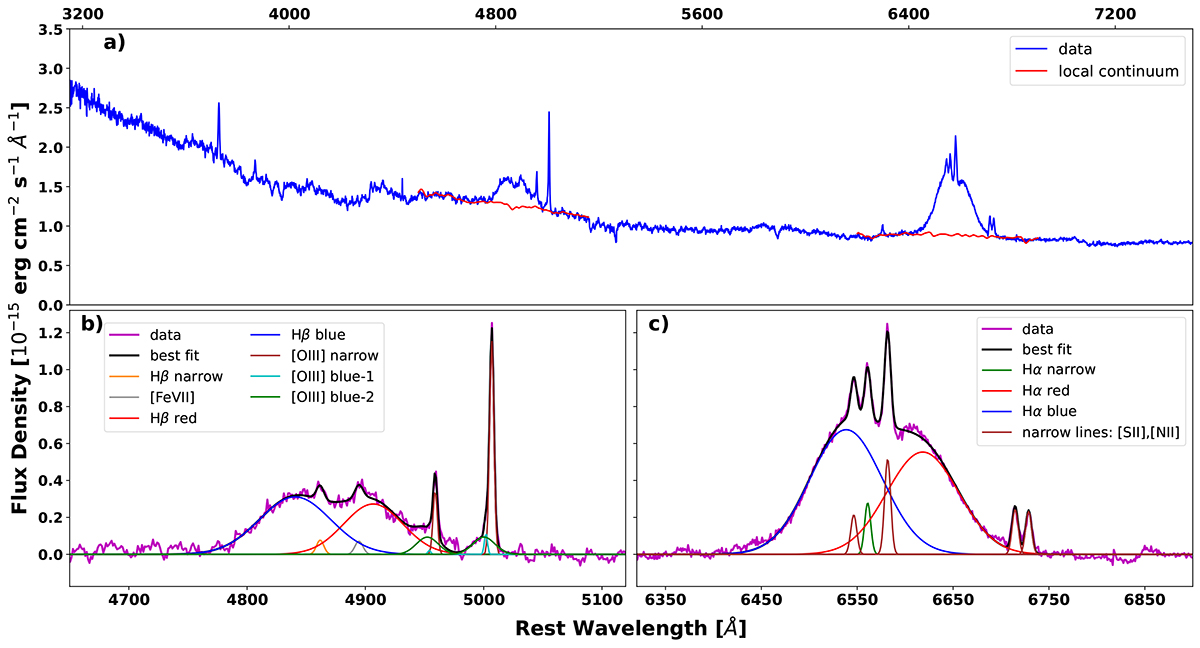
Fig. 5.
Download original image
Spectroscopic analysis of the extinction-corrected Keck spectrum. Panel (a) displays the local continuum fit. We fit the local continuum around the broad Hβ and broad Hα line regions using a power law plus host-galaxy template. Panel (b) shows the local continuum-subtracted Hβ line region. The best-fitting model consists of red- and blueshifted broad Gaussians to fit the broad Hβ emission profile, as well as Gaussian profiles fit to the narrow [O III]λλ4959,5007 doublet, including two blueshifted components for each line. The narrow gray Gaussian profile coincides with [Fe VII]λ4893 emission, but this identification is tentative (see text for details). Panel (c) shows the local continuum-subtracted Hα line region. The best-fitting model includes red- and blueshifted broad Gaussians to fit the broad Hα profile, as with Hβ. There are also narrow Gaussian profiles fit to the [N II]λλ6548,6584 and [S II]λλ6716,6731 doublets, as well as to narrow Hα.
Current usage metrics show cumulative count of Article Views (full-text article views including HTML views, PDF and ePub downloads, according to the available data) and Abstracts Views on Vision4Press platform.
Data correspond to usage on the plateform after 2015. The current usage metrics is available 48-96 hours after online publication and is updated daily on week days.
Initial download of the metrics may take a while.