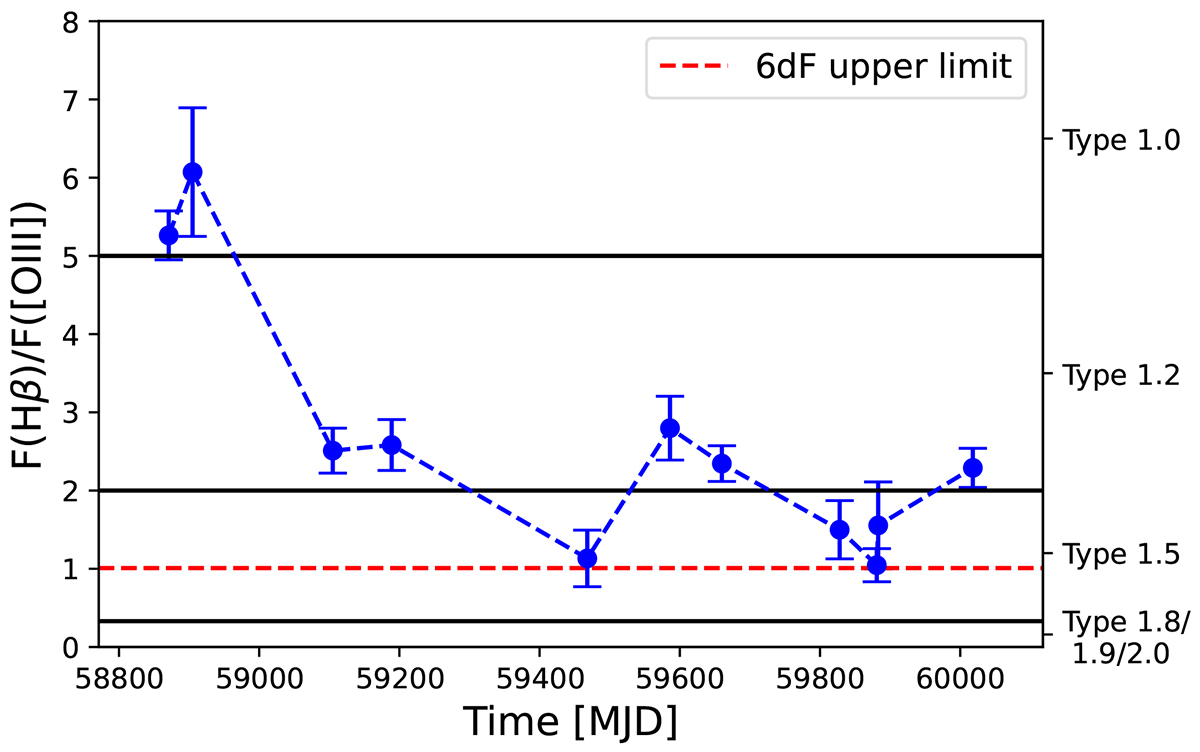
Fig. 6.
Download original image
Ratio of the broad Hβ flux to narrow [O III] λ5007 flux, RHβ/[O III], as a function of time for the 2020–2023 spectra. The ratio is plotted using the round blue marker. The dashed blue line represents the approximate trend. The upper limit to RHβ/[O III] from the archival 6dF spectrum is plotted as the dashed red line. The solid horizontal lines denote the boundaries between Seyfert subtypes following Winkler (1992).
Current usage metrics show cumulative count of Article Views (full-text article views including HTML views, PDF and ePub downloads, according to the available data) and Abstracts Views on Vision4Press platform.
Data correspond to usage on the plateform after 2015. The current usage metrics is available 48-96 hours after online publication and is updated daily on week days.
Initial download of the metrics may take a while.