Open Access
Fig. 8.
Download original image
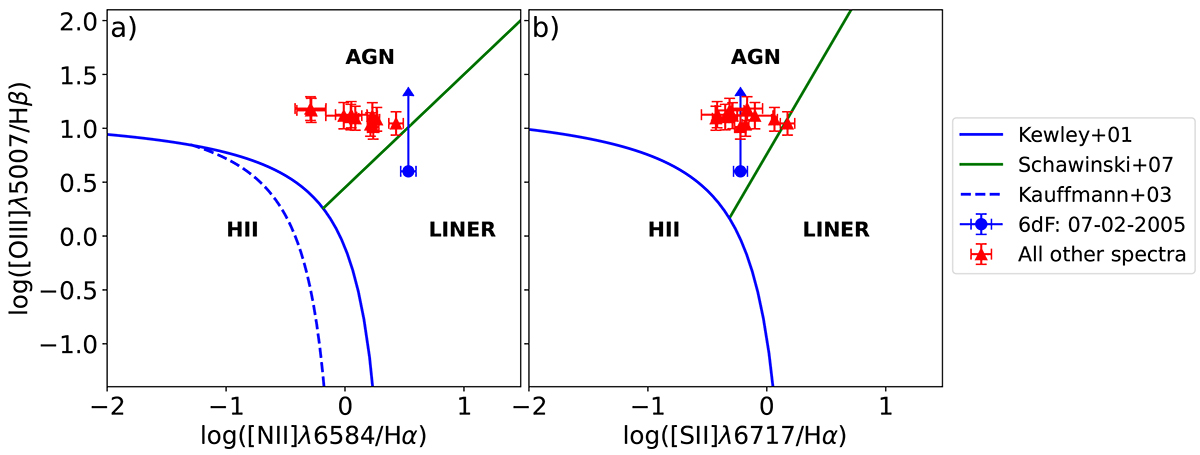
BPT diagrams (Baldwin et al. 1981) to assess the activity in J0428−00. The line ratios (panel a) [N II]λ6583/Hα and (panel b) [S II]λ6717/Hα are plotted against the line ratio [O III]λ5007/Hβ. The classification curves are taken from Kewley et al. (2001), Kauffmann et al. (2003), and Schawinski et al. (2007).
Current usage metrics show cumulative count of Article Views (full-text article views including HTML views, PDF and ePub downloads, according to the available data) and Abstracts Views on Vision4Press platform.
Data correspond to usage on the plateform after 2015. The current usage metrics is available 48-96 hours after online publication and is updated daily on week days.
Initial download of the metrics may take a while.