Fig. 11
Download original image
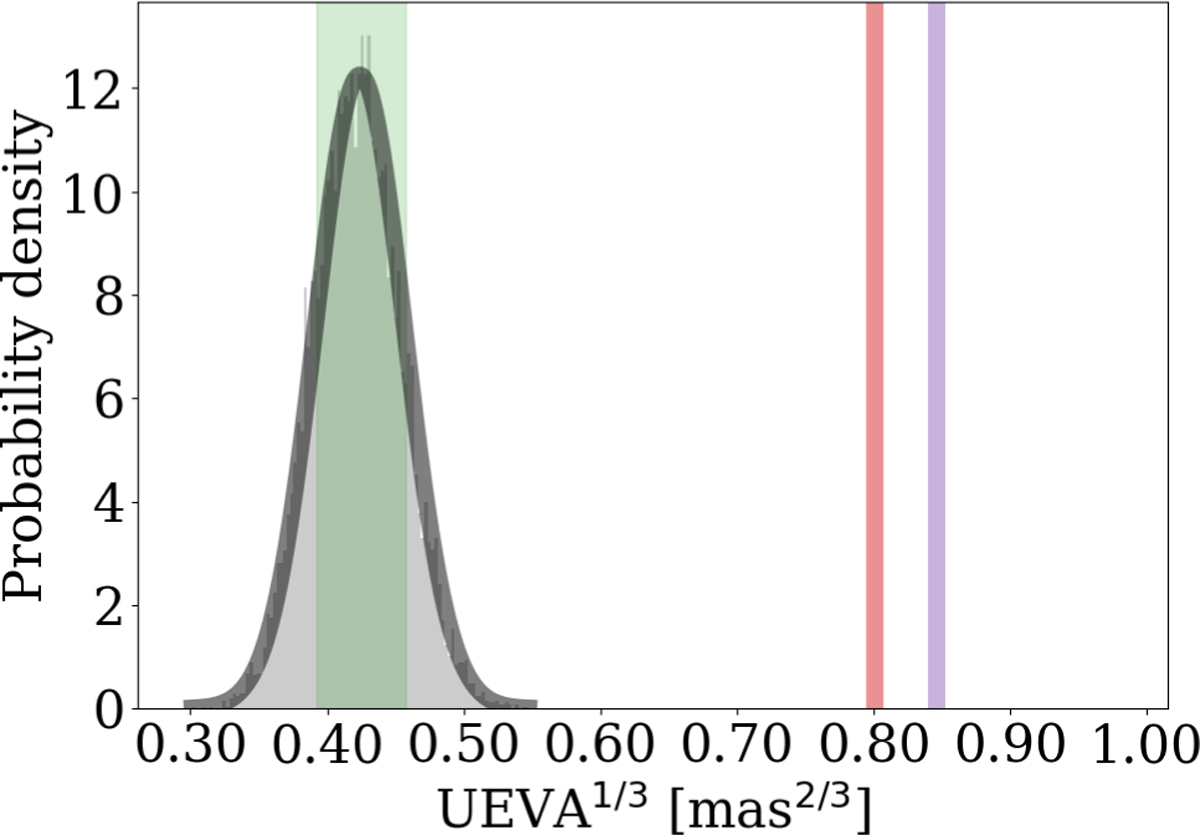
Distribution of UEVA1/3 expected for a single star applied on the case of HD 114762. The green area shows the region spanned by the median plus or minus the standard deviation. The UEVA1/3 estimates from the AEN and ruwe published in the GDR3 archive are shown in red and purple, respectively. The thick black line shows the normal model derived from Eqs. (25) and (26). All values of noises used in the models are given in Table B.1.
Current usage metrics show cumulative count of Article Views (full-text article views including HTML views, PDF and ePub downloads, according to the available data) and Abstracts Views on Vision4Press platform.
Data correspond to usage on the plateform after 2015. The current usage metrics is available 48-96 hours after online publication and is updated daily on week days.
Initial download of the metrics may take a while.