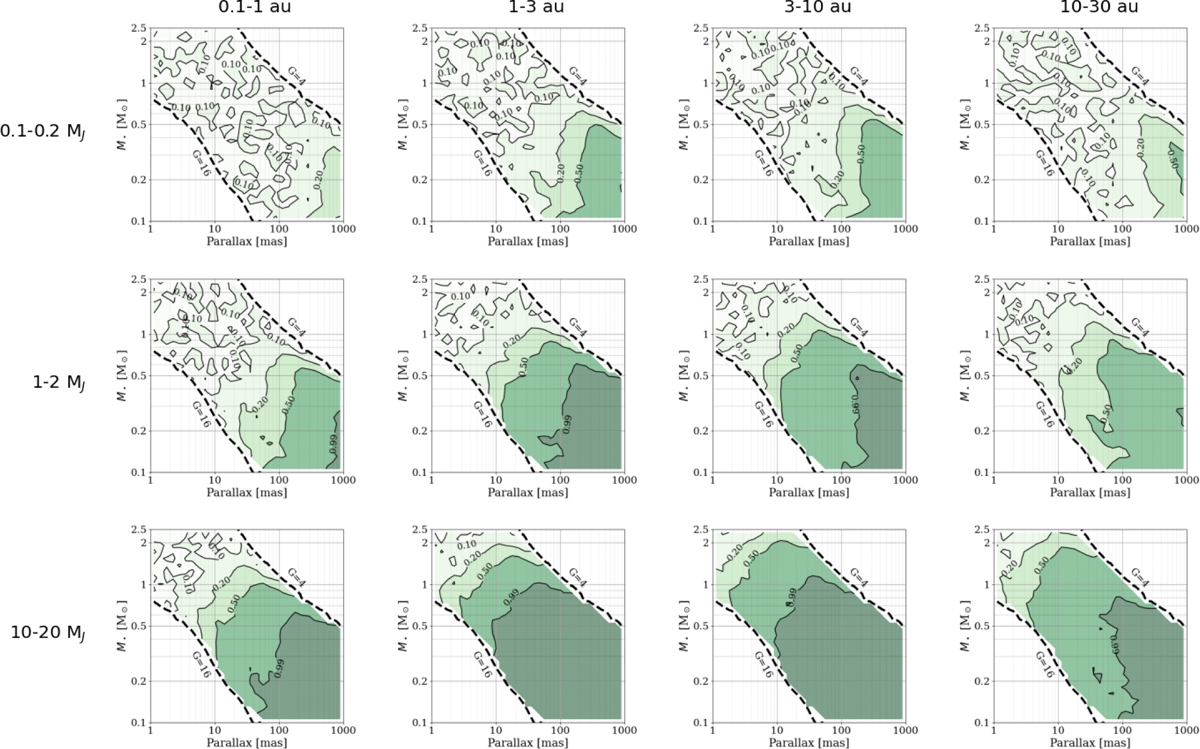
Fig. 27
Download original image
Theoretical detection rates with respect to M* and the parallax. We varied the mass and the sma of the companion according to the column and row labels. White regions show the M* and the parallax for which the probability of companion detection is less than 10%; darker green regions show a probability of detection of >20%,>50% and >99%. The dashed lines show the M*-parallax relations at the limiting magnitudes of G=3 and G=16 derived from Pecaut & Mamajek (2013) tables. Similar figures are obtained considering only ruwe or PMa in Appendix G, in respectively Fig. G.1 and G.2.
Current usage metrics show cumulative count of Article Views (full-text article views including HTML views, PDF and ePub downloads, according to the available data) and Abstracts Views on Vision4Press platform.
Data correspond to usage on the plateform after 2015. The current usage metrics is available 48-96 hours after online publication and is updated daily on week days.
Initial download of the metrics may take a while.