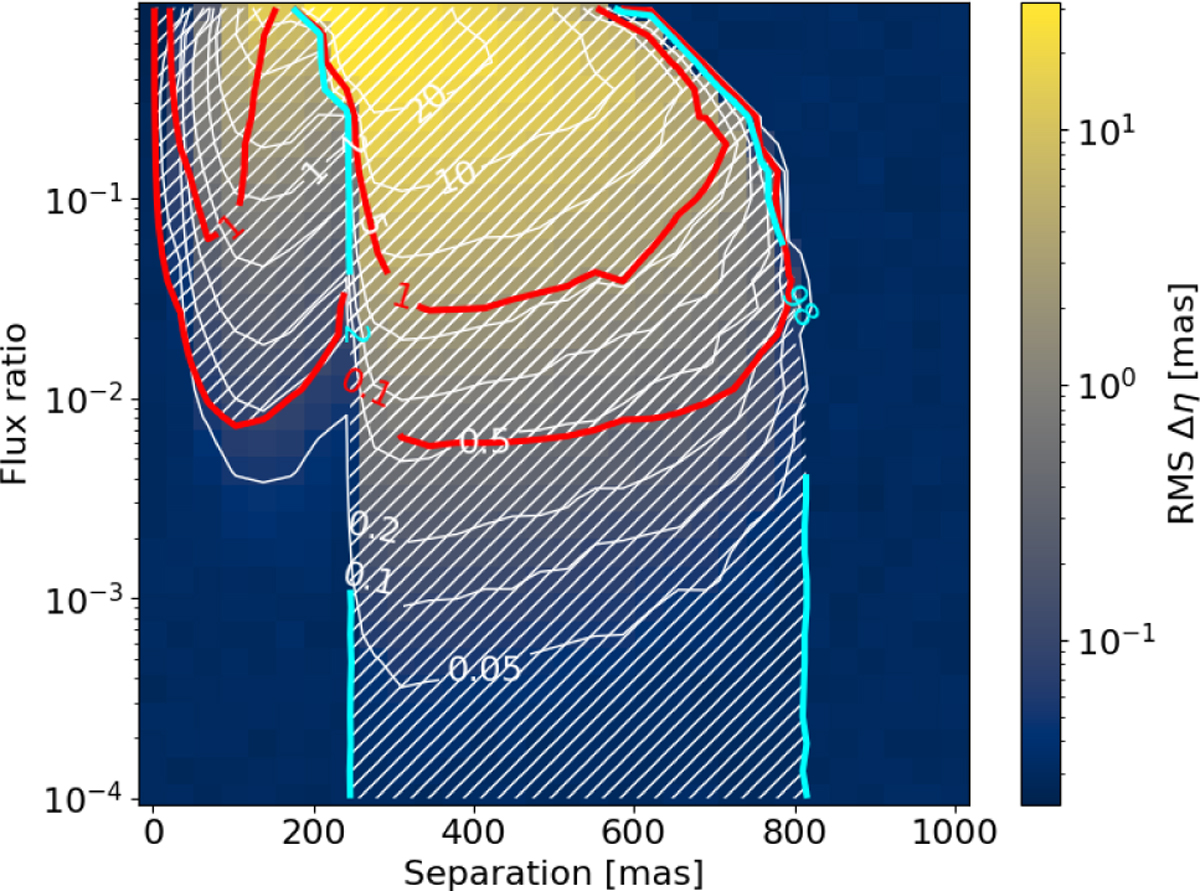
Fig. C.2
Download original image
Photocenter centroid variations RSE with respect to binary separation and flux ratio delineated with white contours. The red contours delineate the GOF amplitude (at levels 0.1 and 1) and the cyan contours delineate the 2 and 98% levels of the IPD_frac_multi_peak. The white hatched region shows, as discussed in the text, where the RMS of the Δη residuals could be larger than 0.1 mas, while outside this region it is always <0.1 mas.
Current usage metrics show cumulative count of Article Views (full-text article views including HTML views, PDF and ePub downloads, according to the available data) and Abstracts Views on Vision4Press platform.
Data correspond to usage on the plateform after 2015. The current usage metrics is available 48-96 hours after online publication and is updated daily on week days.
Initial download of the metrics may take a while.