Fig. 7
Download original image
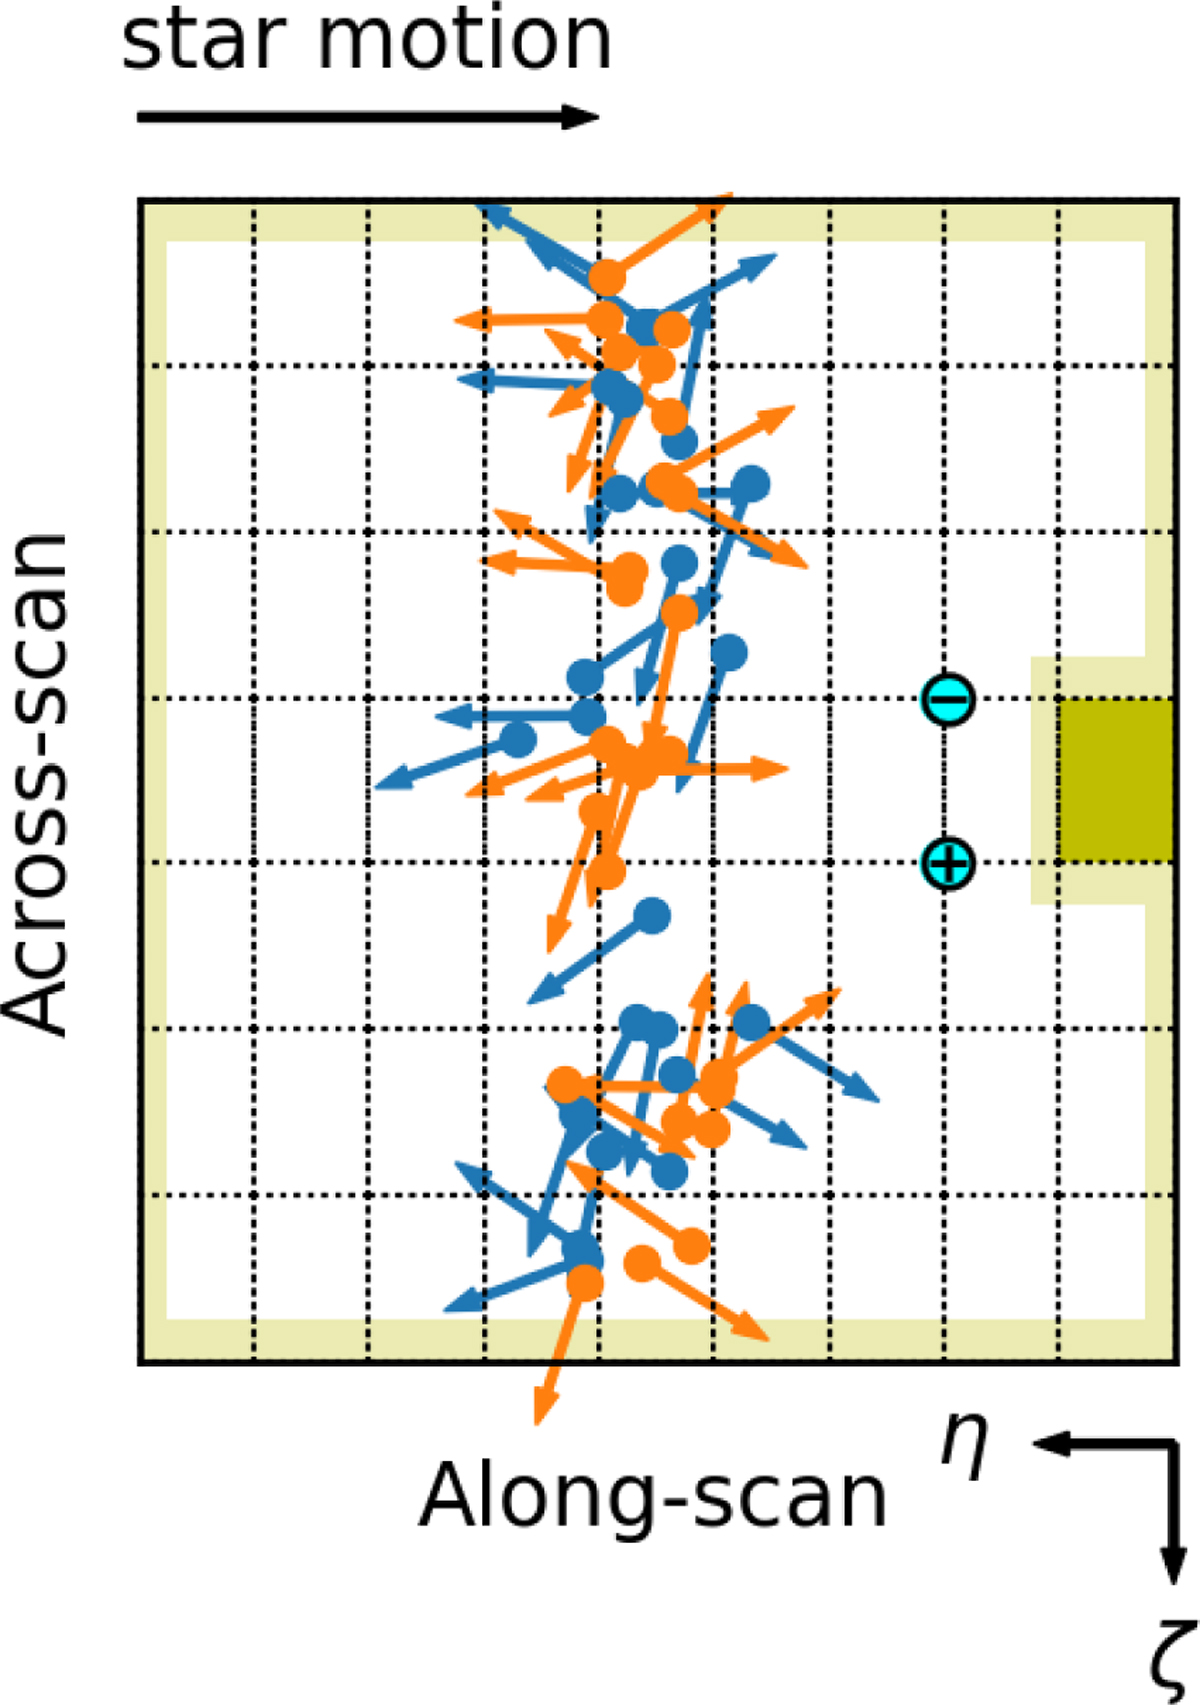
Transits through the detector found for GJ 832 on the preceding FoV (blue) and the following FoV (orange). Each rectangle is a CCD, and the grid is 9×7. The cyan-filled black symbols represent the FoV origins, with a ‘+’ for the preceding and a ‘−’ for the following FoV. The black arrow at the top shows the direction of the source motion through the FoV. The dots show the average positions of the star on the detector at different epochs. The arrow connected to the dot indicates the average north direction at that epoch. The yellow regions depict the assumed dead zones, with the darker rectangle corresponding to the WFS2.
Current usage metrics show cumulative count of Article Views (full-text article views including HTML views, PDF and ePub downloads, according to the available data) and Abstracts Views on Vision4Press platform.
Data correspond to usage on the plateform after 2015. The current usage metrics is available 48-96 hours after online publication and is updated daily on week days.
Initial download of the metrics may take a while.