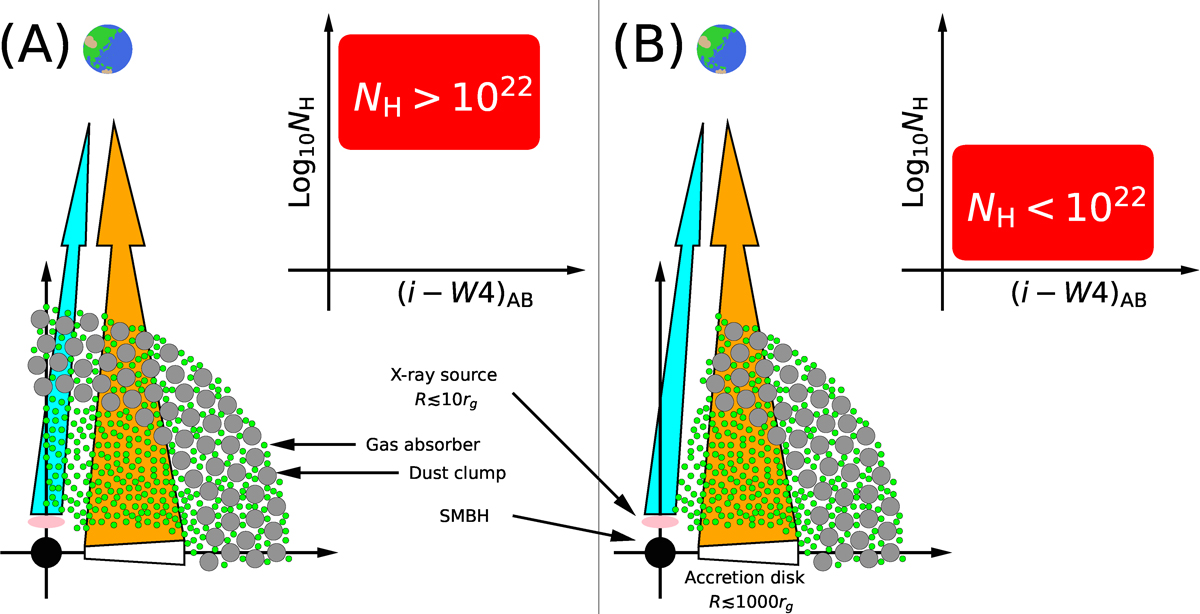
Fig. 11.
Download original image
Illustration explaining the (i − W4)AB vs. NH relationship based on geometry. Filled black, gray, and cyan circles denote SMBHs, dust clumps, and gas absorbers, respectively. Filled pink ellipses and white trapezoids represent X-ray sources and accretion disks, respectively. Cyan and orange arrows indicate fluxes from X-ray sources and accretion disks, respectively.
Current usage metrics show cumulative count of Article Views (full-text article views including HTML views, PDF and ePub downloads, according to the available data) and Abstracts Views on Vision4Press platform.
Data correspond to usage on the plateform after 2015. The current usage metrics is available 48-96 hours after online publication and is updated daily on week days.
Initial download of the metrics may take a while.