Fig. 5.
Download original image
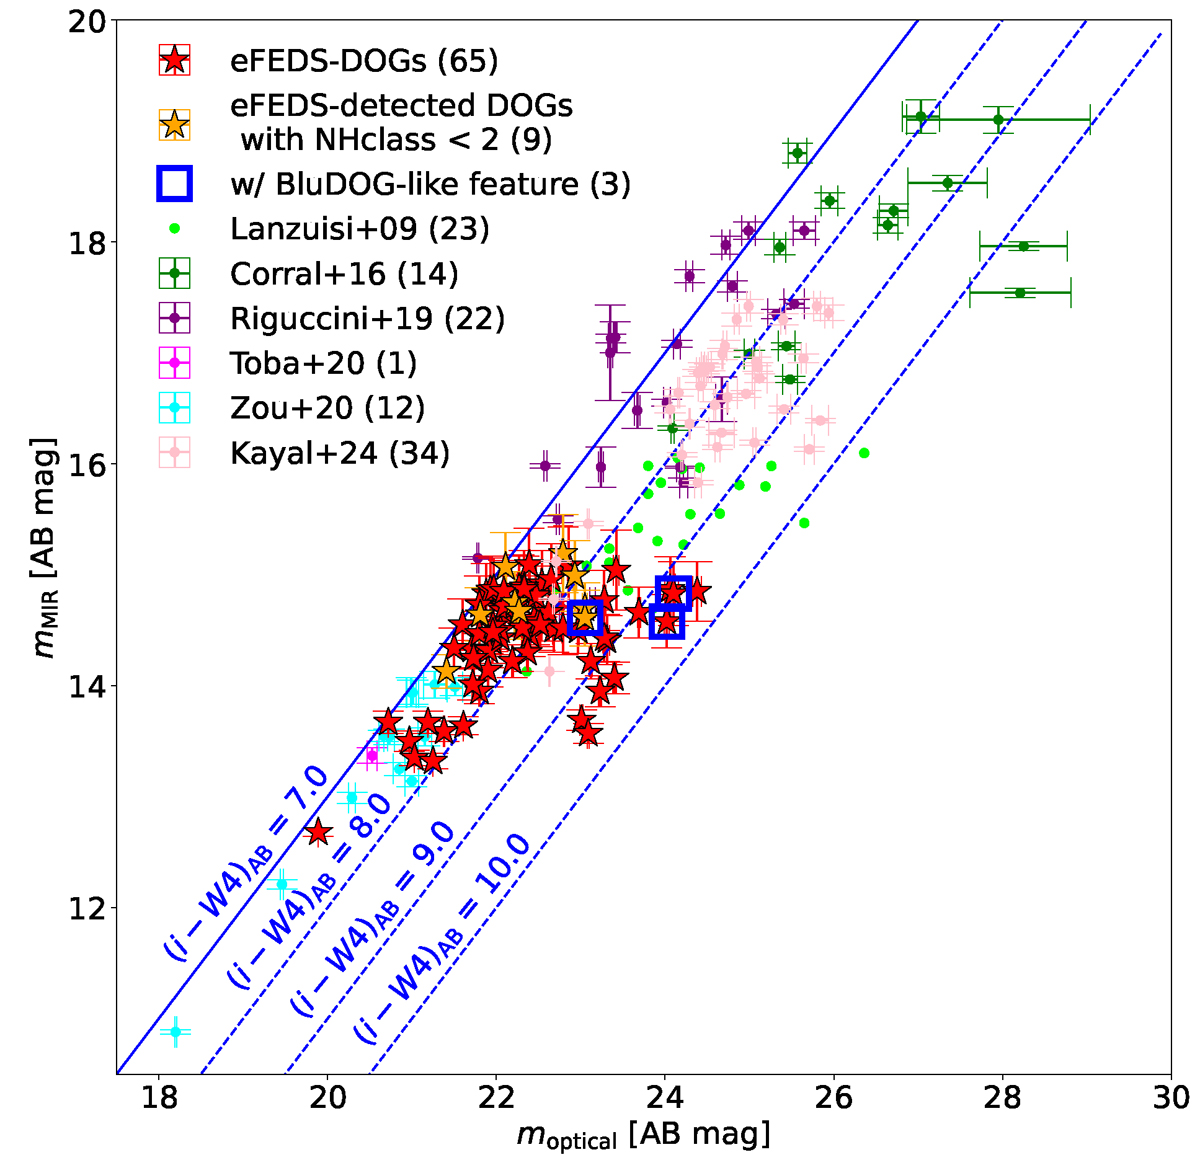
MIR band versus optical band magnitudes of eFEDS-DOGs as well as previous X-ray detected DOGs. Red and orange stars denote eFEDS-DOGs and eFEDS-detected DOGs with NHclass < 2, respectively. Blue squares show eFEDS-DOGs with the BluDOG-like feature. Lime, Green, purple, magenta, cyan, and pink plots denote X-ray detected DOGs from Lanzuisi et al. (2009), Corral et al. (2016), Riguccini et al. (2019), Toba et al. (2020), Zou et al. (2020), and Kayal & Singh (2024), respectively. For the sample fainter than mMIR > 15 mag (e.g., Lanzuisi et al. 2009; Corral et al. 2016; Riguccini et al. 2019), we utilized Spitzer/MIPS 24 μm bands as mMIR. The optical bands were obtained from the Hubble/ACS F775 band (Corral et al. 2016), Suprime-Cam iAB′ bands (Riguccini et al. 2019) and heterogeneous optical magnitudes by Vizier with the nearest matching with < 3 arcsec (Lanzuisi et al. 2009). The solid red line represents the DOGs criterion, and three dashed red lines denote (i − W4)AB = 8.0, 9.0, and 10.0. The numbers in parentheses indicate the number of objects.
Current usage metrics show cumulative count of Article Views (full-text article views including HTML views, PDF and ePub downloads, according to the available data) and Abstracts Views on Vision4Press platform.
Data correspond to usage on the plateform after 2015. The current usage metrics is available 48-96 hours after online publication and is updated daily on week days.
Initial download of the metrics may take a while.