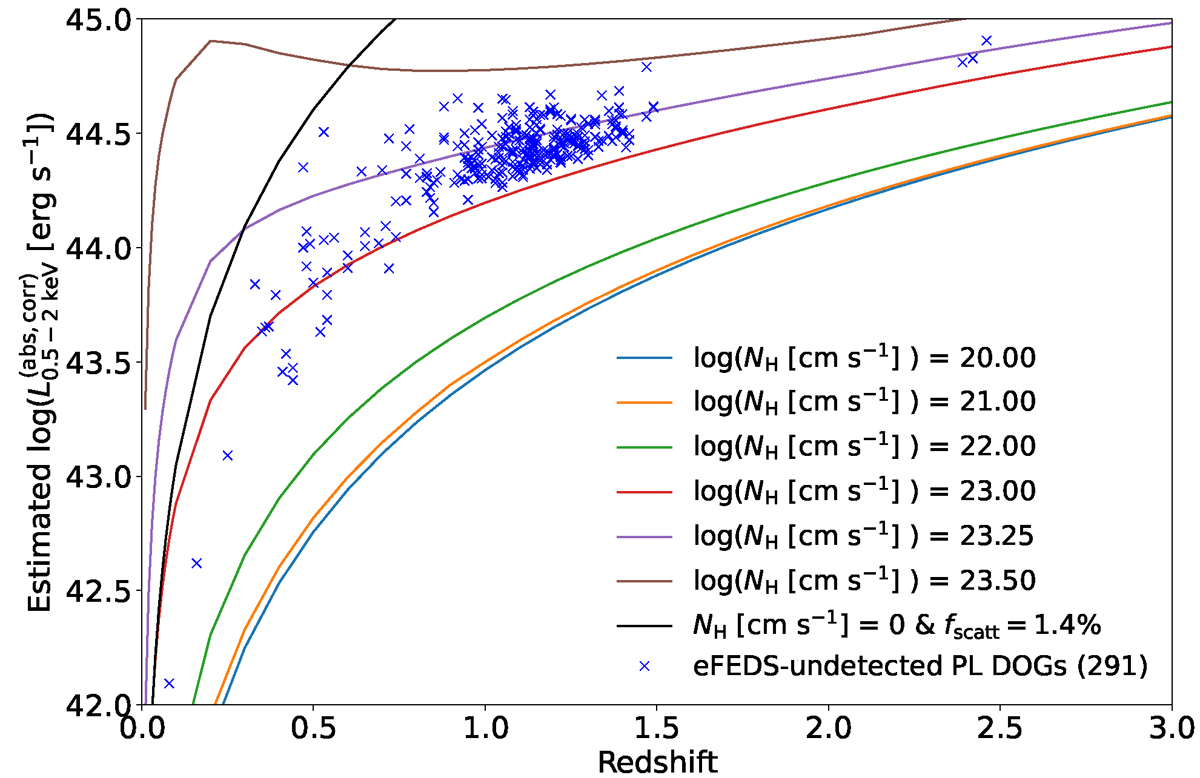
Fig. 8.
Download original image
Distribution of the eFEDS-undetected PL DOGs in the plane of L0.5 − 2 keV(abs, corr) and redshift. The L0.5 − 2 keV(abs, corr) were estimated from the obtained L6 μm, by utilizing the luminosity relation between L2 − 10 keV(abs, corr)–L6 μm (e.g., Chen et al. 2017), and extrapolated the expected L0.5 − 2 keV(abs, corr) by assuming the photon index of Γ = 1.8. The blue crosses represent the eFEDS-undetected PL DOGs. The solid blue, orange, green, red, purple, and brown lines represent the limiting luminosities between 0.5 and 2.0 keV with corresponding log(NH/cm−2) of f20, 21, 22, 23, 23.25, and 23.5, respectively. For calculating the limiting luminosities, we utilize a flux limit of f0.5 − 2 keV = 6.5 × 10⁻¹⁵ erg s−1 cm−2. The solid black line represents the upper bound of the expected X-ray luminosities by assuming that the eFEDS X-ray band is dominated by the X-ray scattered component with fscatt = 1.4%. This is equivalent to a value that is 100/1.4 times above the curve of NH/cm−2 = 0.
Current usage metrics show cumulative count of Article Views (full-text article views including HTML views, PDF and ePub downloads, according to the available data) and Abstracts Views on Vision4Press platform.
Data correspond to usage on the plateform after 2015. The current usage metrics is available 48-96 hours after online publication and is updated daily on week days.
Initial download of the metrics may take a while.