Fig. 9.
Download original image
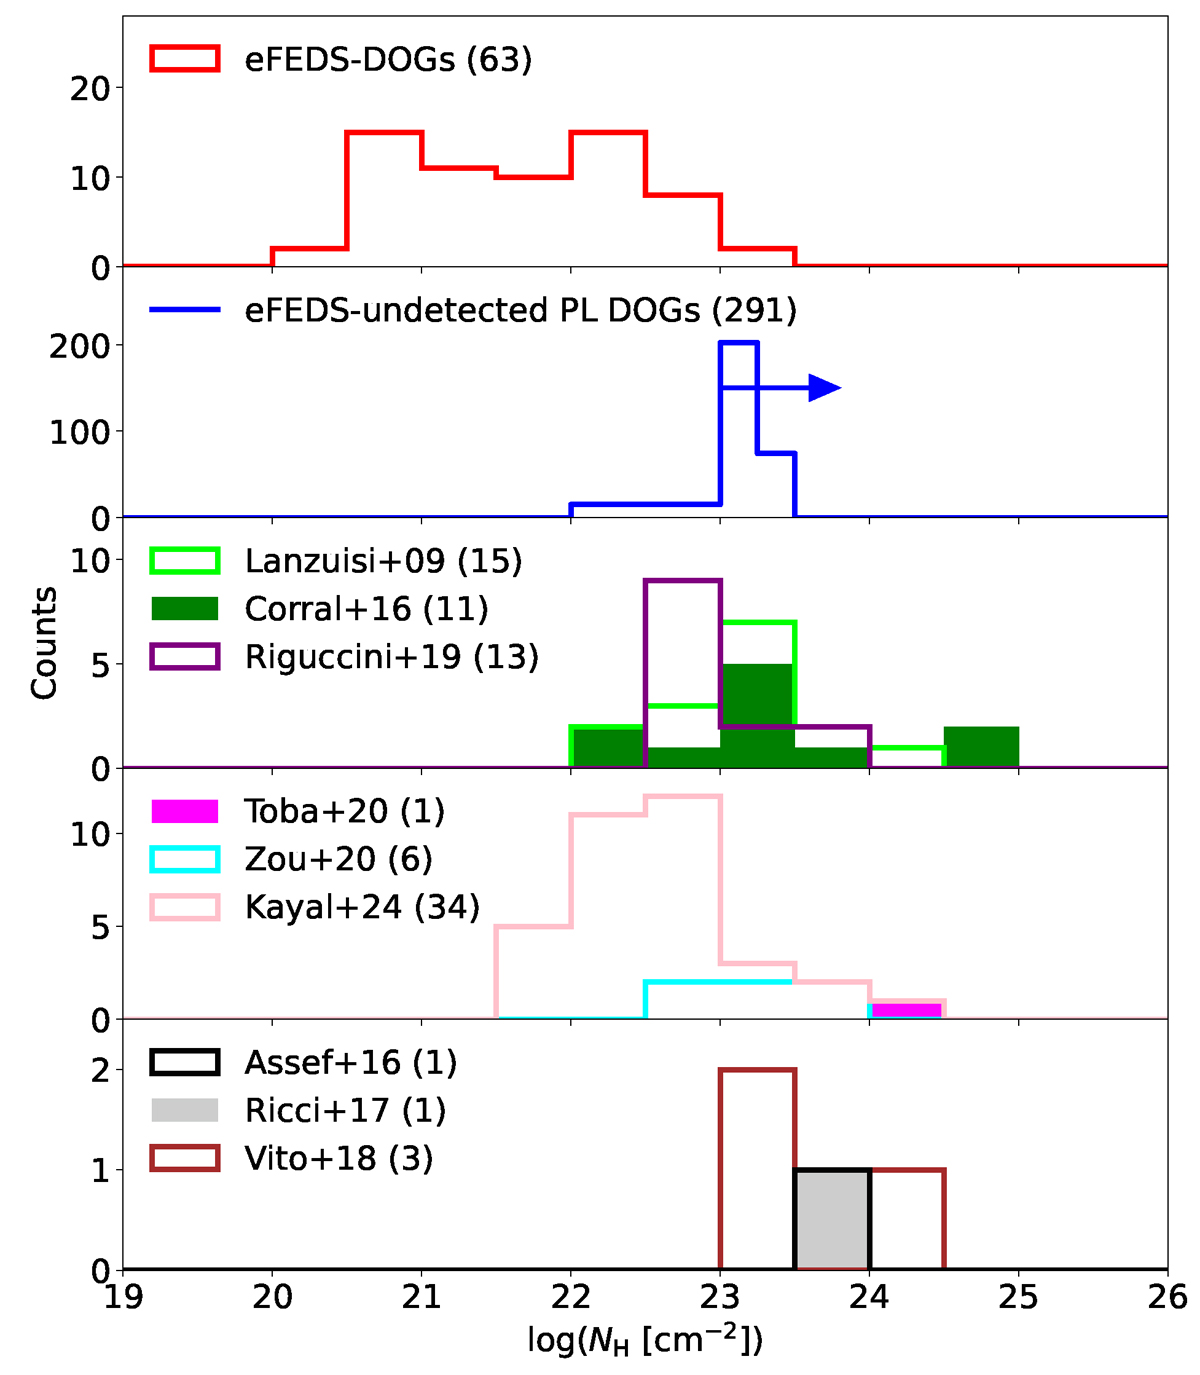
NH histogram with a bin width of 0.5 dex. Top panel: A red histogram represents eFEDS-DOGs. Second panel: A blue histogram represents eFEDS-undetected PL DOGs, indicating lower limits on log(NH/cm−2). Note that only this panel uses a different binning scheme: 22.0–23.0, 23.00–23.25, and 23.25–23.50. Third panel: Lime, green and purple histograms represent Lanzuisi et al. (2009), Corral et al. (2016) and Riguccini et al. (2019), respectively. Fourth panel: Magenta, cyan, and pink histograms represent Toba et al. (2020), Zou et al. (2020), and Kayal & Singh (2024), respectively. Bottom panel: black, gray, and brown histograms represent Assef et al. (2016), Ricci et al. (2017a), and Zappacosta et al. (2018), respectively.
Current usage metrics show cumulative count of Article Views (full-text article views including HTML views, PDF and ePub downloads, according to the available data) and Abstracts Views on Vision4Press platform.
Data correspond to usage on the plateform after 2015. The current usage metrics is available 48-96 hours after online publication and is updated daily on week days.
Initial download of the metrics may take a while.