Open Access
Fig. 1.
Download original image
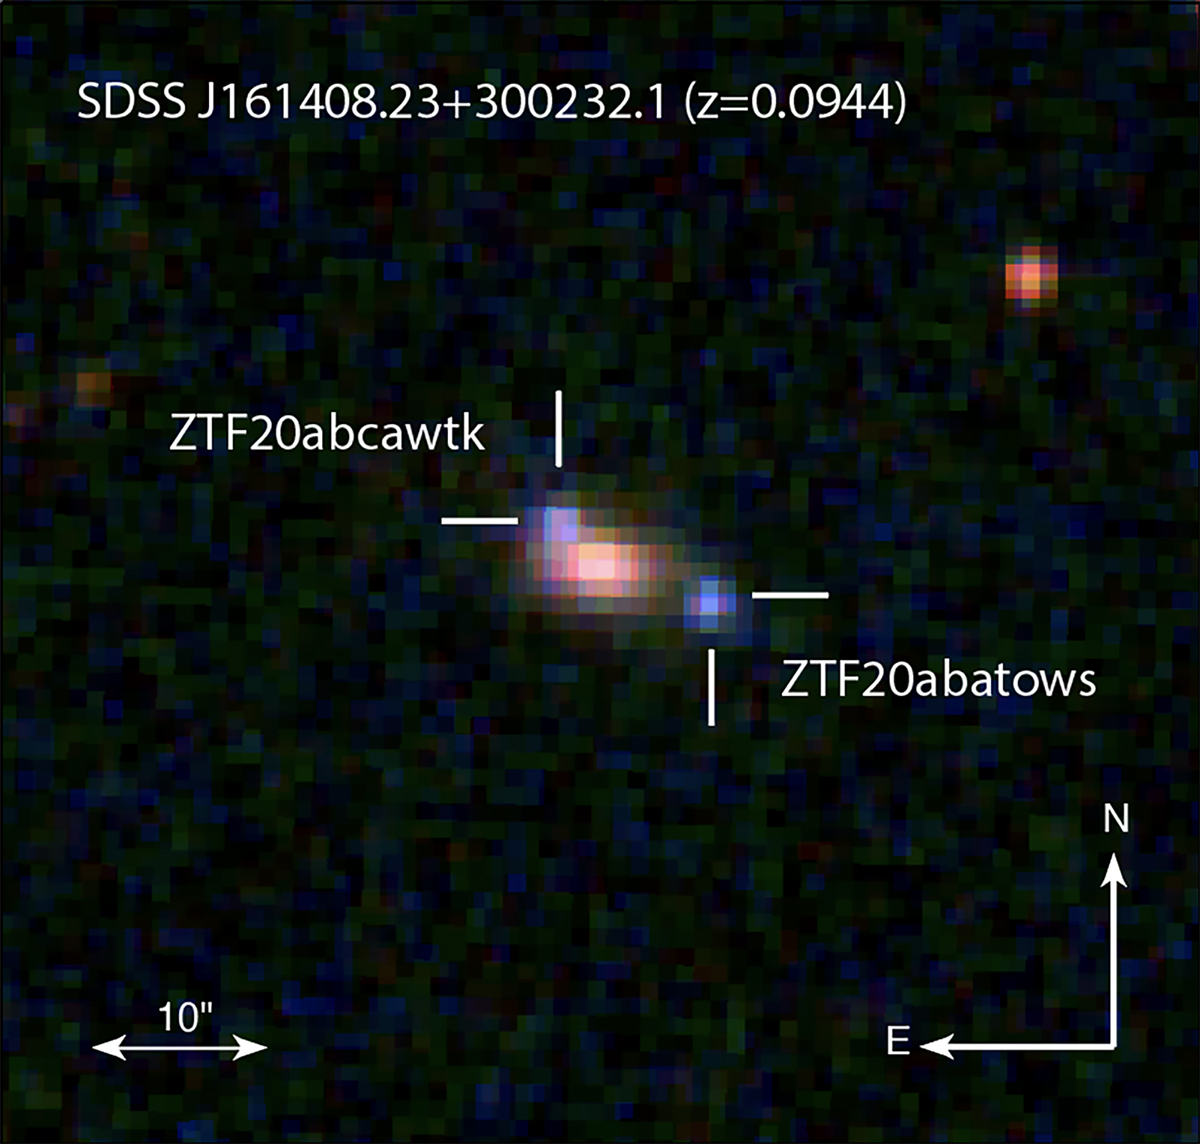
Zwicky Transient Facility RGB image of an example sibling pair from our sample: ZTF20abatows and ZTF20abcawtk. The crosses mark the position of the SNe Ia in the field. These siblings were closest in the time separation (∼5 days between peak for the two SNe) between their peaks and hence were detectable at the same time.
Current usage metrics show cumulative count of Article Views (full-text article views including HTML views, PDF and ePub downloads, according to the available data) and Abstracts Views on Vision4Press platform.
Data correspond to usage on the plateform after 2015. The current usage metrics is available 48-96 hours after online publication and is updated daily on week days.
Initial download of the metrics may take a while.