Fig. 3.
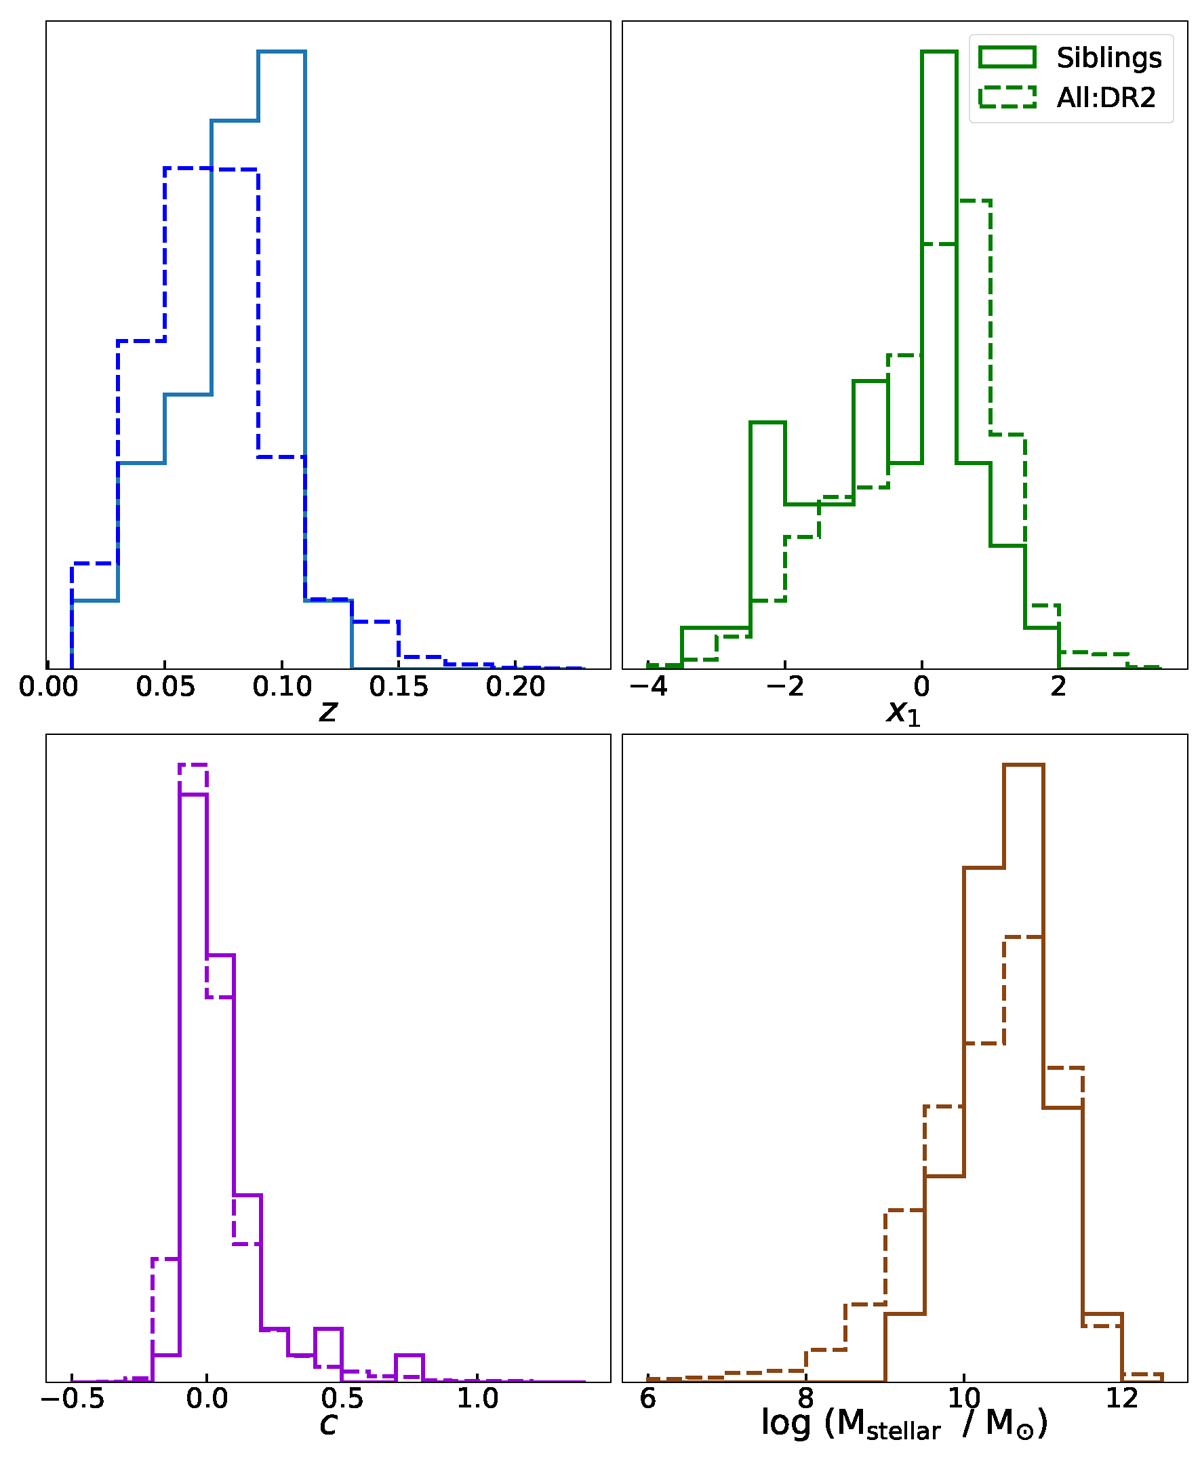
Download original image
Parameters for the sibling SNe Ia in this study. The panels show the redshift (top left), SALT2 x1 (top right), c (bottom left), and host galaxy stellar mass (bottom right) distributions. We did not make any selection cuts on the values of z, x1, and c, unlike for the complete DR2 sample (Rigault et al. 2025). The equivalent distribution for the entire DR2 sample is overplotted as dashed lines Smith et al. in prep.
Current usage metrics show cumulative count of Article Views (full-text article views including HTML views, PDF and ePub downloads, according to the available data) and Abstracts Views on Vision4Press platform.
Data correspond to usage on the plateform after 2015. The current usage metrics is available 48-96 hours after online publication and is updated daily on week days.
Initial download of the metrics may take a while.